
Wednesday, October 31, 2012
Oct 31, 2012
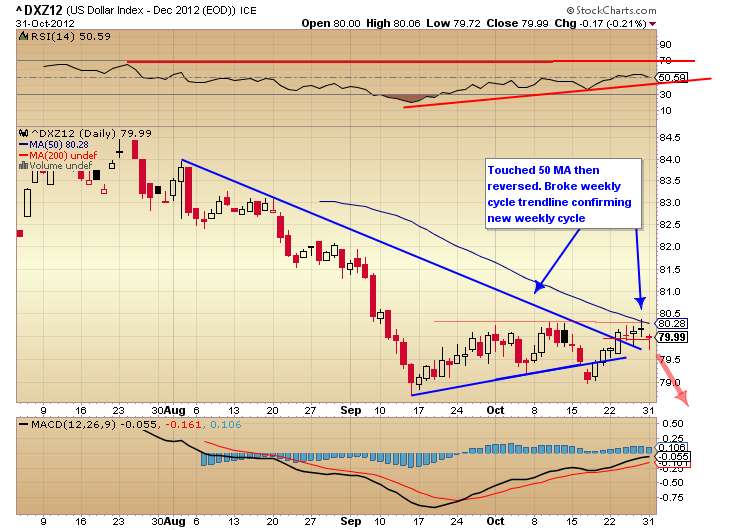
Today marked day 10 of the new daily cycle in the Dollar. We moved off of the highs in the $80.30 range yesterday to bottom at $79.70 this morning. Price tried to recapture the $80 mark, but has been unsuccessful so far. Before falling, price touched the 50 MA.

Tuesday, October 30, 2012
Oct 30, 2012
The Markets were closed again today but futures continued electronically.
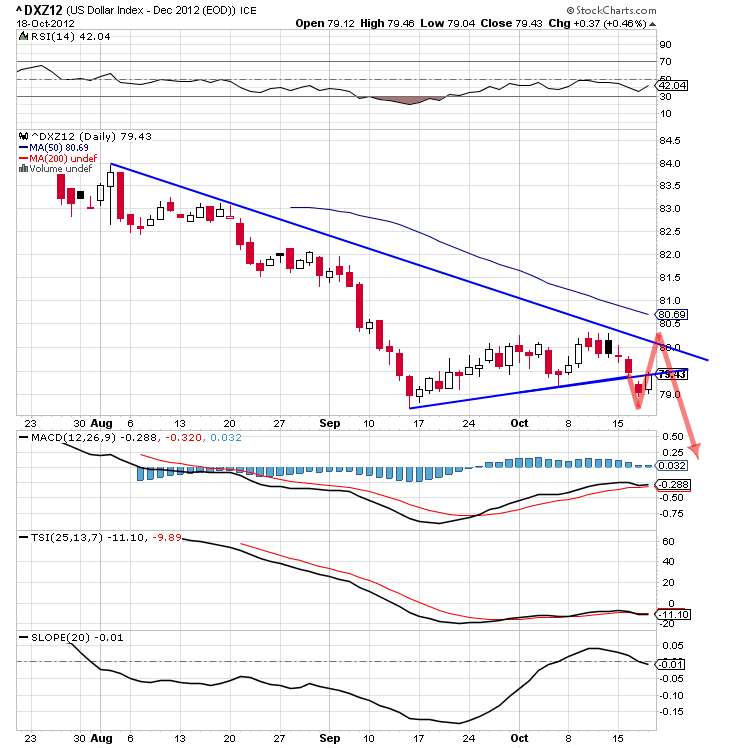
The Dollar is on day 9 of it's new daily cycle. I believe it peaked on day 8. Since that high, we've fallen out of the ascending wedge as I noted on the last post was forming. Once price broke, it fell below $80, and has been unable to regain it this evening. This is a very bearish scenario and anymore selling pressure should get the ball rolling. Over the past 35 sessions, the dollar has closed over $80 only 3 times.

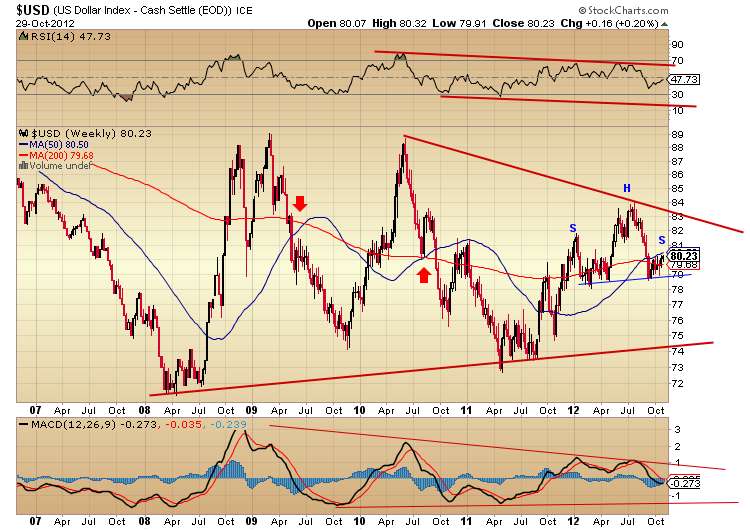
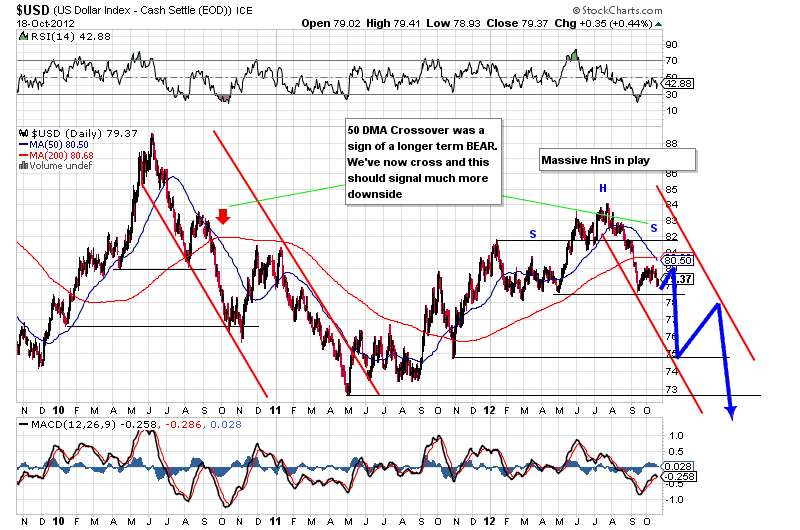
Here's a longer term look at the dollar. You can see the long term channel that we're trading in. After kissing the top of it just a few weeks ago, we're now destined to have a date with the lower end of the channel. This is in the $74 range. The head shoulders is beginning to take shape. The 50MA has crossed over the 200MA. Every instance of this happening in the past has been followed through with several months of selling.

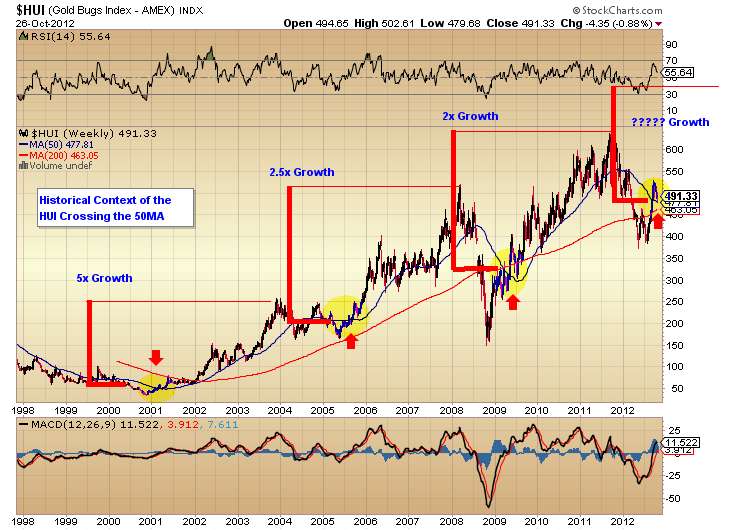
Miners may have a very big year coming up. Here's a look at the $HUI. Take note of the MA crosses. Every single time that we've had a 50>200 MA cross, we've seen tremendous gains. Well, that has just occurred again. That is why I am long GDX.

Metals were largely unchanged on the day. I have a feeling this is coming to a very abrupt ending very soon.
The Dollar is on day 9 of it's new daily cycle. I believe it peaked on day 8. Since that high, we've fallen out of the ascending wedge as I noted on the last post was forming. Once price broke, it fell below $80, and has been unable to regain it this evening. This is a very bearish scenario and anymore selling pressure should get the ball rolling. Over the past 35 sessions, the dollar has closed over $80 only 3 times.
Here's a longer term look at the dollar. You can see the long term channel that we're trading in. After kissing the top of it just a few weeks ago, we're now destined to have a date with the lower end of the channel. This is in the $74 range. The head shoulders is beginning to take shape. The 50MA has crossed over the 200MA. Every instance of this happening in the past has been followed through with several months of selling.
Miners may have a very big year coming up. Here's a look at the $HUI. Take note of the MA crosses. Every single time that we've had a 50>200 MA cross, we've seen tremendous gains. Well, that has just occurred again. That is why I am long GDX.
Metals were largely unchanged on the day. I have a feeling this is coming to a very abrupt ending very soon.
Monday, October 29, 2012
Oct 29, 2012
The NYSE is closed today due to Hurricane Sandy. Most commodities are flat to down today as money flows moved to strengthen the $USD. I am posting this update for this reason, to show you that I believe we are in the last push of this new daily cycle in the dollar. As we are in a an intermediate Bear trend, this should prove to be a left translated daily cycle before leading to the bottom. From a technical side the dollar is painting a very large head and shoulders. Currently, price is right up against the left shoulder resistance as well as the 50 MA resistance. In the second chart below, you can see the very bearish ascending wedge forming and closing in on it's peak. Even though the dollar is testing it's highs again today, metals have yet to put in a lower low or match last weeks lows.

The following chart is a 5 hour current look of the USD. It's noted on the longer term chart above by the red arrow on the right hand side. This ascending triangle is a very bearish formation.


The following chart is a 5 hour current look of the USD. It's noted on the longer term chart above by the red arrow on the right hand side. This ascending triangle is a very bearish formation.

Thursday, October 25, 2012
Oct 25, 2012
Story of the day, GDX.
As mentioned yesterday, GDX broke from it's descending triangle. I mentioned either the breakdown would follow through or it would be a bear trap. Well, GDX opened today with a gap up of 3%. I priced out options yesterday at 3:50pm and realized they were all selling at a deep discount. However, I did not have enough time to pull the trigger. Today all options appeared to be selling at a premium for current underlying levels. Notice how the day's candle returned to the the inside of the formation today. I'd also like to note, that it's typical for a false breakout in one direction to be followed by a large move in the other direction as a counter. Let's see if we get anymore follow through tomorrow.
Wednesday, October 24, 2012
Oct 24, 2012
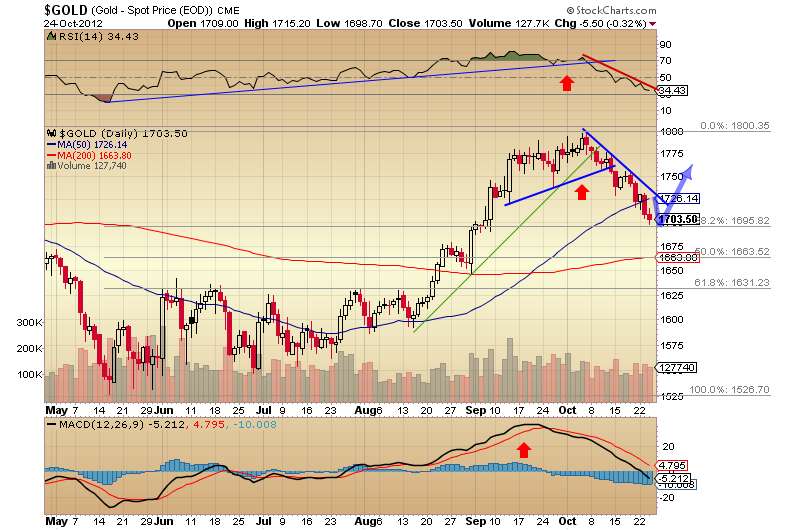
Just a few updated charts for tonight updating the progress of the dollar top and metals bottom. One thing to note is that SPY topped the list of BOW numbers today. GLD remained in the top 10 and was near the top yesterday.
Money Flows - Buying on Weakness
Gold:

Money Flows - Buying on Weakness
Gold:
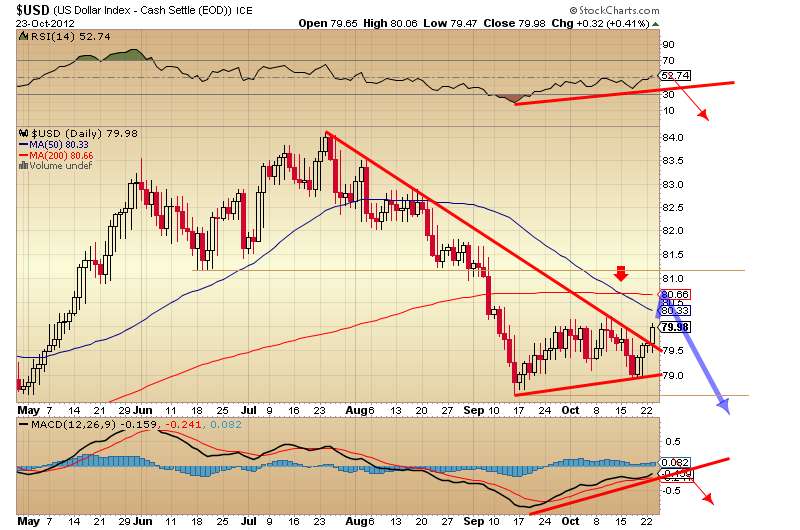
Tuesday, October 23, 2012
Oct 23 2012
The dollar broke it's trending weekly resistance level today. Having just broken this, I would expect a few more days of upward action. However, I believe the moving averages will provide enough resistance to cap the rally. Equities and metals will continue to slide until the dollar tops.

Sunday, October 21, 2012
Weekend Report - Ending 19 Oct, 2012
Charts provided without commentary..
I think there's more squeeze coming in metals. Dollar should rally to about $81 or so and top out against the 200 MA. Look at past rallies and see how the corrections used the 200 as support.. until it crossed. Then it goes back up and tests it as resistance. We've just broken below the 200 MA (along with the 50 MA, a huge bearish signal) so now it only makes sense to top out around that level. Consequently, the 200 MA will be between $80.50-81.00 depending on how long it takes to get there.
This pushes metals into extreme oversold conditions. Silver as low as $30.50 and Gold as low as $1695.
I don't think the dollar will be able to close above the 200 MA, and if it does, something in the fundamentals will have changed in the short term. Heavy selling should come in at that point.
Dollar Short Term

Thursday, October 18, 2012
Oct 18, 2012
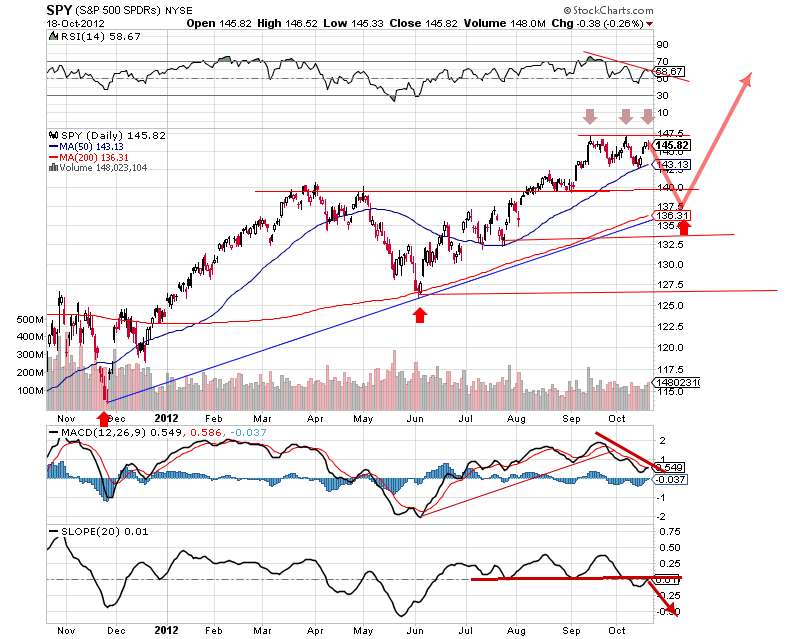
Today was the day we have been looking forward to for a week or so. The Dollar has put in it's swing low signaling a reversal. Today's action closed higher than the intra-day high of yesterday.. thus signaling the reverse in sentiment and it's buying strength. Our next important point to look forward to is back towards the $80 level where the dollar should meet it's multi month downward trend which was set back in August. This should provide enough resistance needed to continue this multi month slide.

Here's a longer term view of the Dollar. Notice that now we've had the 50 MA cross the 200 MA. Also take note of the massive head and shoulders pattern in play.

Stocks weakened today. I fully expected another day or two of upside, but the reversal in the dollar signaled some selling. It's hard to see on this chart, but a big red candle was charted for the day. Indicators are showing weakness. This is a chance for a short term "short" on the S&P before we head to higher highs and eventually landing near $1550 in the spring.

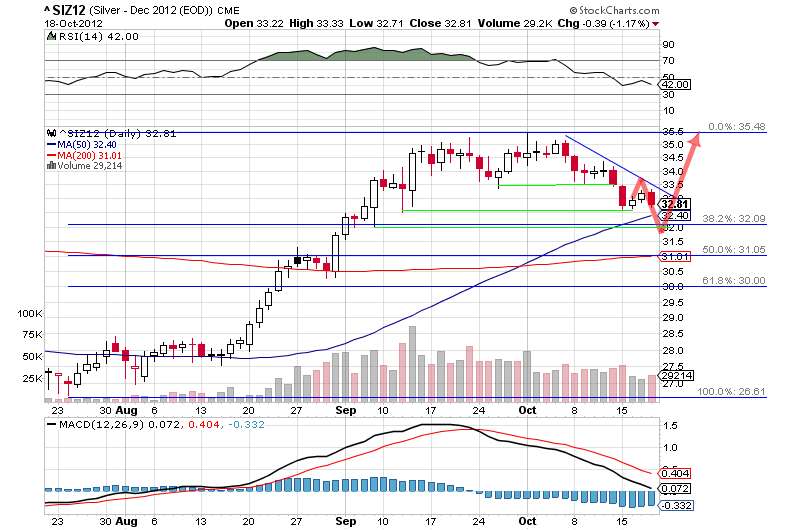
There's not much to add today for silver. Just like stocks, it sold itself a bit short of resistance and put in a swing high today reversing the trend. Next we wait for a bottom. The 38.2 retracement should be good support right around $32 or just under.

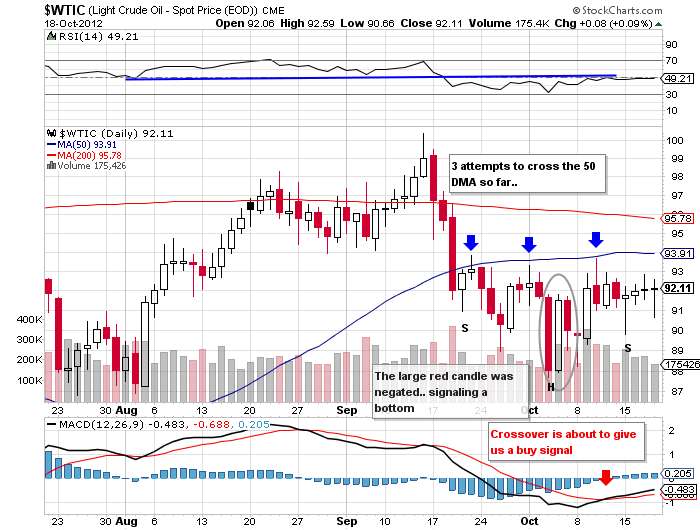
Oil seems to be in a sideways consolidation pattern. It is being held below the 50 MA. In this consolidation, we've formed a rough, but obvious inverse head and shoulders. Once we break the trendline and blow the 50 MA, oil should move upward quite explosively. Also notice from the last time I updated oil, I pointed out that the MACD was about to give a buy signal. It has since crossed and more buying should come into play soon, especially once the dollar weakens again.

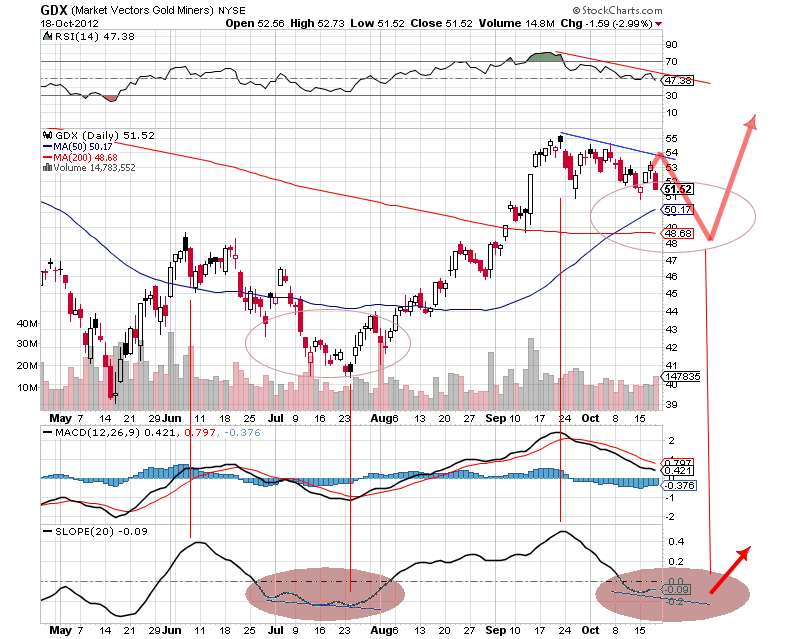
GDX put in a very aggressive swing high today. The price really dropped. I would love nothing more than to see GDX drop to the 200 MA and give us a buy opportunity around $48. However, the 50 MA could provide support and turnaround right at $50. Either way, I am very big on miners because of how beat down they were after gold and silver's major decline last year. The prices in miners are very cheap in contrast to where they were before the long correction period. This leads me to believe they have a lot of making up to do. With general equities rallying over the next few month as well as gold, these miners should really move. I will be a buyer whenever we confirm a low.

Conclusion - The Dollar should find a top in the next 7-10 days. I really don't see it rallying anymore than that because of the strong multi month resistance. This should push metals and stocks down into weekly lows.. which I expect all to rally out very strongly.
Here's a longer term view of the Dollar. Notice that now we've had the 50 MA cross the 200 MA. Also take note of the massive head and shoulders pattern in play.
Stocks weakened today. I fully expected another day or two of upside, but the reversal in the dollar signaled some selling. It's hard to see on this chart, but a big red candle was charted for the day. Indicators are showing weakness. This is a chance for a short term "short" on the S&P before we head to higher highs and eventually landing near $1550 in the spring.
There's not much to add today for silver. Just like stocks, it sold itself a bit short of resistance and put in a swing high today reversing the trend. Next we wait for a bottom. The 38.2 retracement should be good support right around $32 or just under.
Oil seems to be in a sideways consolidation pattern. It is being held below the 50 MA. In this consolidation, we've formed a rough, but obvious inverse head and shoulders. Once we break the trendline and blow the 50 MA, oil should move upward quite explosively. Also notice from the last time I updated oil, I pointed out that the MACD was about to give a buy signal. It has since crossed and more buying should come into play soon, especially once the dollar weakens again.
GDX put in a very aggressive swing high today. The price really dropped. I would love nothing more than to see GDX drop to the 200 MA and give us a buy opportunity around $48. However, the 50 MA could provide support and turnaround right at $50. Either way, I am very big on miners because of how beat down they were after gold and silver's major decline last year. The prices in miners are very cheap in contrast to where they were before the long correction period. This leads me to believe they have a lot of making up to do. With general equities rallying over the next few month as well as gold, these miners should really move. I will be a buyer whenever we confirm a low.
Conclusion - The Dollar should find a top in the next 7-10 days. I really don't see it rallying anymore than that because of the strong multi month resistance. This should push metals and stocks down into weekly lows.. which I expect all to rally out very strongly.
Wednesday, October 17, 2012
Oct 17, 2012
Tonight is an update using the same charts as the ones I used last night. Stockcharts has been agreat resource for me because the underlying data on the chart can continue to update over any edits I have made. This really helps me to confirm trendlines and predicted moves without having to redraw the charts.
For reference, please compare tonight's charts with the charts I posted last night. The only edits I made was to go back into the chart and make the predicted move lines a bit opaque so that we could see the underlying price moves below them.
First up.. the dollar. It's behaving just as I had hoped. It dropped through the daily trendline and has found support near $79. If we do not go lower from here, I expect a few days of recovery with the dollar testing the $80-81 mark again. We've had about a month of positive action, so if we're turned away on the downward slope around $80, I expect a deeper decline to $78.
Tuesday, October 16, 2012
Oct 16th, 2012
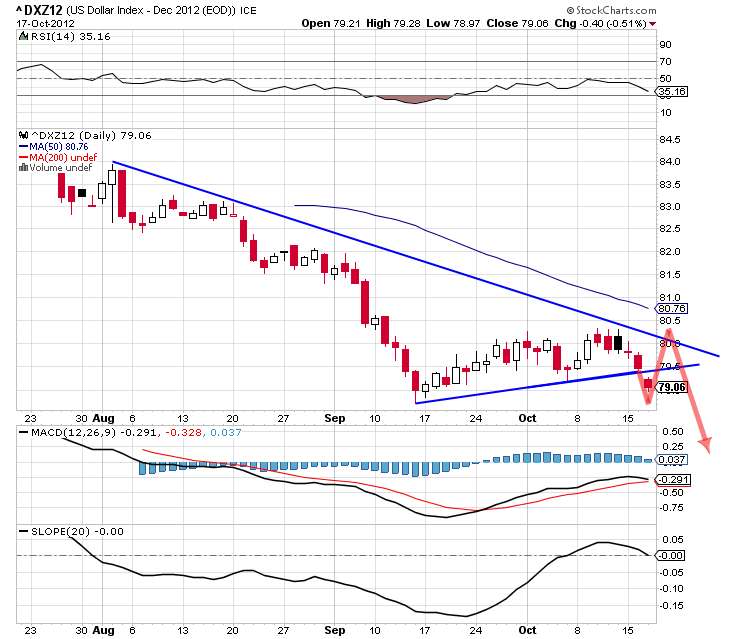
Today I needed to reevaluate my short term thoughts on the the dollar. After hours tonight, price has broken much lower going below what we thought could have been a low on Oct 5th. Price is hovering just above $79 right now. The low on the 5th did not confirm as you can see I added the Slope (linear regression) as it is a very good trend indicator and it did not move lower on the Oct 5th low. The slope is very near to turning over and giving a sell signal now confirming that we have a weakened trend and that price will move into a new low. Remember, price always follows path of least resistance. Once we are able to print a daily low in the next few days, we should reverse and then find resistance off of the weekly trendline set back in August at the beginning of this leg down. This high will finish off the lows in metals and signal a reversal.

Monday, October 15, 2012
Oct 15th, 2012
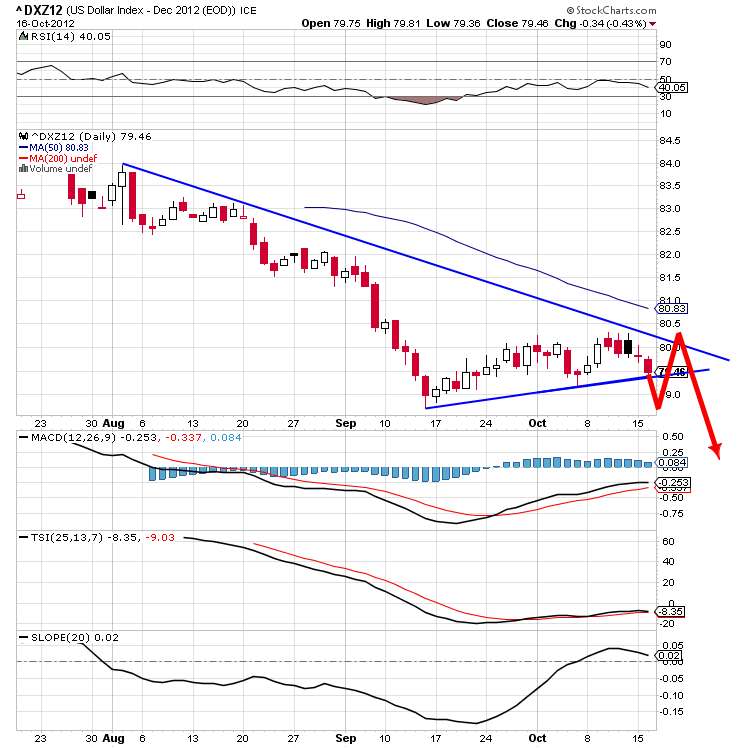
The dollar had another indecisive day today, the third in a row. It's action is very similar to what we saw the last couple of weeks in it's bear flag. I expect a continued trend higher within the channel, until we break.

Thursday, October 11, 2012
Oct 11, 2012
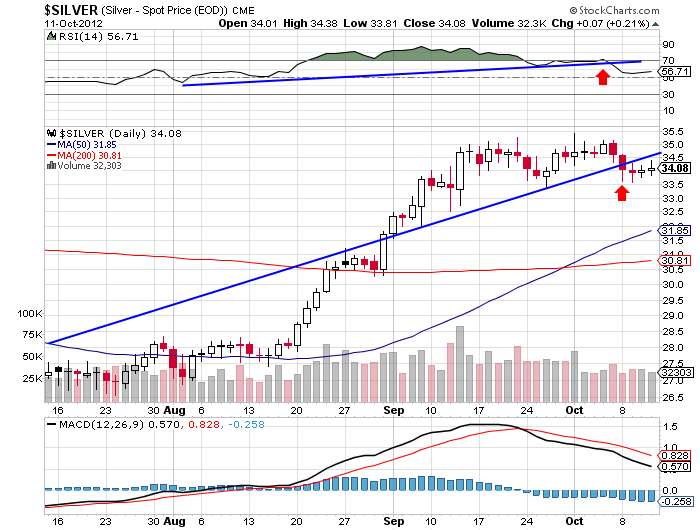
There's not much to update today. I wanted to take this time to zoom in close on silver action and show this specific trendline break. Silver must regain this zone in order to proceed. If not, downside could come at any time. 50 DMA level should provide any downside support.

Wednesday, October 10, 2012
Oct 10, 2012
I want to take a step back from the current style of trading that I have been pursuing. Job changes prevent me from having access to the markets throughout the day and preventing huge losses with current volatility has been impossible. I want to begin a new path of identifying larger trends and cycles that can be traded over weeks and months while maintaining a consistent return and limited downside risk. I want my primary interests to continue in Silver, Gold, USD, Metals Miners, and Energy. I prefer to stay from equities in general strictly because of the risks associated with individual companies. The exception to this rule is a general following of the S&P which I feel aids in the understanding of the general market sentiment. I also feel that I have a better understanding of this sector of the market and I refuse to trade something that I do not know. It is never in the interest of risk management to do so.
Subscribe to:
Posts (Atom)