Wednesday, December 19, 2012

Dec 19, 2012

It's been a tough trading year and there are only a few days left to get things straight. At this point, metals are nearly unchanged. This consolidation did not come without action, however.

There are many rumors flying about the blogosphere currently about why metals have corrected along with the dollar. I'll leave it up to you to find these and figure out which myth makes the most sense to you. It's in my best interest to try and ignore the noise and keep track of our cycles.

Sentiment has been very low since this breakdown in metals has occurred. This must mean that a bottom is very near.

There are several ways to approach what has happened. I'm not going to present all theories here. It's too time consuming and exhausting. So, I'll cover what I think  is going on with the cycles and we'll use that framework as we move along into the new year.

Tuesday, December 18, 2012

Dec 18, 2012

Today was a very important day in the metals. Unfortunately I just dont have time tonight to cover everything tonight. There will be a new update sent out tomorrow evening with fresh cycle counts and expectations to give us an idea of where we stand and what perhaps we can expect as we go into the new year. The market has thrown us many curveballs in the last few weeks and today was no different. We have a lot to cover. Stay tuned..

..until tomorrow, have a great night!

Sneak peak..

Early November was a fakeout ICL. Price never touched the 200 MA leaving behind a gap. Today, that mark was reached almost to the penny. A stretched ICL could be in play. We all know what comes from the result of ICLs right?!?


Monday, December 17, 2012

Dec 17, 2012

It's been a few days since my last update. Not much has happened, so I'll make it quick just to point out a few important changes.

The $USD has formed a failed daily cycle. I've talked about this several times. The intermediate and yearly cycle declines are in full force. Today was day 7 of the current daily cycle. It broke below the previous DCL, therefore creating a failed daily cycle. These are normally indicative of an intermediate decline. The average DC runs 18-28 days. This gives us 5-10 more days of downside.


Wednesday, December 12, 2012

Dec 12, 2012

Big day today!

The Fed released a statement at 1230 today indicating it would begin purchasing an additional $45 Billion in Mortgage Backed Securities per month beginning on Jan 1st, 2013. This is to take place of the expiring Operation Twist. OT is balance sheet neutral for the Fed. The buying of MBS is not. So, in total for the year of 2013, the Fed will print and expand it's balance sheet by $1 Trillion. This policy is open ended.. or until the unemployment figure hits 6.5%.

This is the inflationary fundamentals we need in place to make money from the metals bull market.

So, you ask.. why did we not see more fireworks today? Gold and silver are actually down in after hours right now.

Perhaps today was an emotional one for everyone.. but not so much for the big money of which we rely on to move this market. So how is it possible that we have such a big announcement and no big action to show for it?

Take a look at Money Supply (M1).


Now compare that to the price of gold over the same period..


Monday, December 10, 2012

Dec 10, 2012

Quick update tonight..

The swing for gold is in!

On Friday I said, "A swing low has not happened yet, but this was a nice setup to achieve one on Monday."

The swing is in, and we have also broken the declining daily cycle trendline. This validates the start of a new DC. This is the 2nd DC of a new Intermediate cycle.

Today is day 1.


Sunday, December 9, 2012

Dec 07, Weekend Report

Since the $USD is the kind of underlying to everything we do.. let's tackle it first.

The dollar has thrown us several curve balls over the last couple of weeks. At first we thought we had a cycle bottom. It was then confirmed by a swing low on DAY 1! Also on the same day, the dollar reversed and sold off even harder creating a swing high and beginning a new decline! This lasted for only 7 days before creating another low. Since then, the dollar has created a swing low and broke the declining daily cycle trendline. The difference is, this time it was confirmed by a follow through. Since we had that "fakeout" daily cycle in the middle, we had a lot of confusion. But that "fakeout" only lasted for 7 days and no daily cycle has ever been 7 days. Therefore, the previous daily cycle was an EXTENDED daily cycle and bottomed on day 33.


Tuesday, December 4, 2012

Dec 04, 2012

Story of the day.. US Dollar.

The second headline is how metals are dropping.. while the dollar is dropping. Many are scratching their heads over this. The dollar is feeling incredible selling pressure from it's intermediate and yearly cycle decline.. therefore, the selloff. The metals are feeling pressure from their daily cycle decline. Once this DCL is in for metals.. lookout for a quick reversal. Remember the dollar has dropped significantly..

In my last update, I mentioned an alternate scenario where the dollar topped in it's new daily cycle.. on day 1. This is incredibly rare, and in my opinion, incredibly bearish. I went back and counted until I got tired, and I couldn't find a daily cycle that topped on day 1 of a new daily cycle.

The dollar bottomed, formed a swing low, then immediately reversed and began trending down. It has since formed a swing high. Confusing, I know.


Long term view..

Thursday, November 29, 2012

Nov 29, 2012

So the dollar threw us for a loop today.. it decided to print a lower low.

This invalidates what I said yesterday about the dollar printing it's daily cycle low yesterday. It didn't.. and it appears that it may have today. Majority of the time, once a low is printed, we can confirm with a swing low. Notice I saad "majority", not "all" of the time. If the market always made sense, then anyone could trade it.

That makes the dollar's last cycle a stretched cycle putting in it's low on day 30. The normal timing band is 18-28 days. That doesn't mean that it HAS to bottom within that time period, it's just the average time period. Sometimes it can go short and sometimes it can go longer.. although both are very rare.

There's also one other alternate scenario.. and it's that the dollar actually did begin a new daily cycle yesterday, printed it's high, and then began immediately to reverse into a new DCL. This is HIGHLY unlikely, but I just wanted to throw that out there.

For the sake of time, I will not repeat everything I wrote about the dollar and it's timing that I wrote yesterday. Just go back and read it, then apply it one day forward to today's low. I expect the dollar to rally for 4-6 more days from here.

Note the red trendline.. we'll need to break above that to confirm a new swing low.


Wednesday, November 28, 2012

Nov 28, 2012

Today was an odd day in the markets. Gold sold off heavily.. rumors of a fat finger from some institution. The Dollar rose early to form a swing low and then reversed to end the day below the open.

With today being the swing low candle on the dollar, that marks day 1 of a new daily cycle. As mentioned before, I'm expecting left translated bearish cycles.. due to the draw from the intermediate and yearly cycle decline pulling price down. What this means is that the dollar rally out of the bottom will be short lived. I believe the earliest the dollar could top is on day 4 and perhaps the longest it could go is on day 8. So, let's settle it in the middle and say the dollar will top on day 6.. deal? That gives us until about next Wednesday to find a top in the dollar and a low in metals.

For some reason.. my live charts that I use to track real time prices throughout the day posted a much different looking candle than my stockcharts subscription. I'll post both for your review.


Friday, November 23, 2012

Nov 23, 2012 - Weekend Update

So far the cycles have impressed me and have really helped me keep a handle on the progress and directional movements of the market. Today was a big day for metals, and the dollar dropped like a rock.


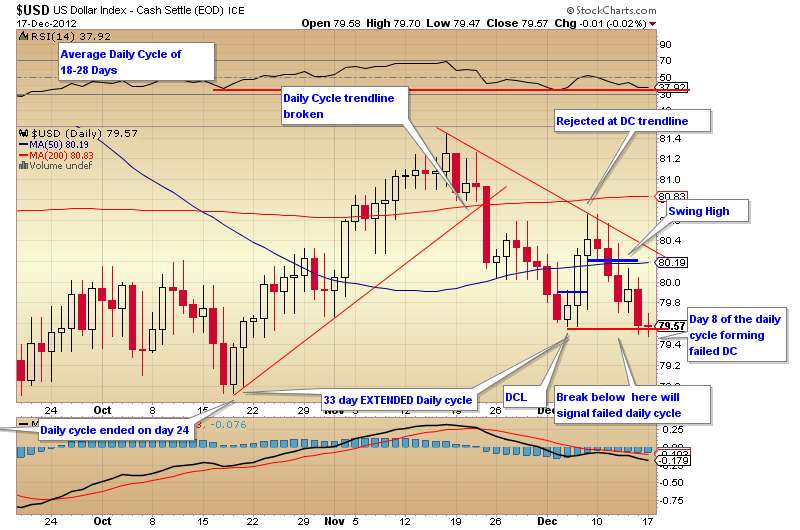
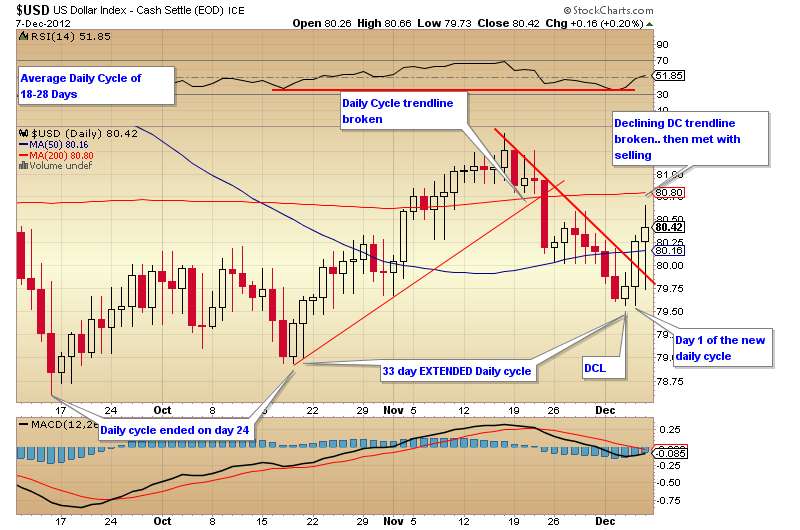
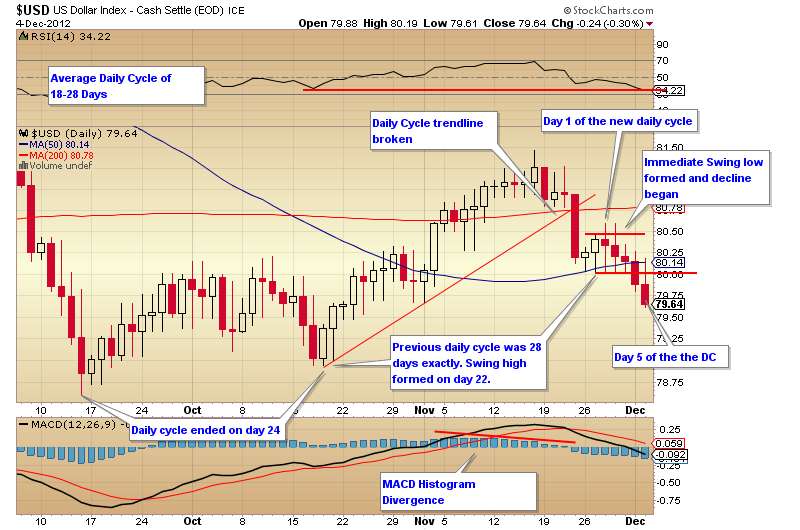
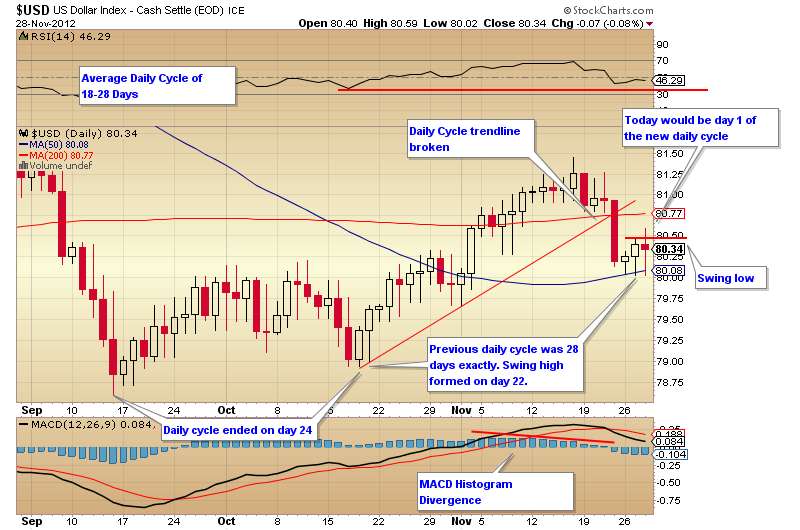
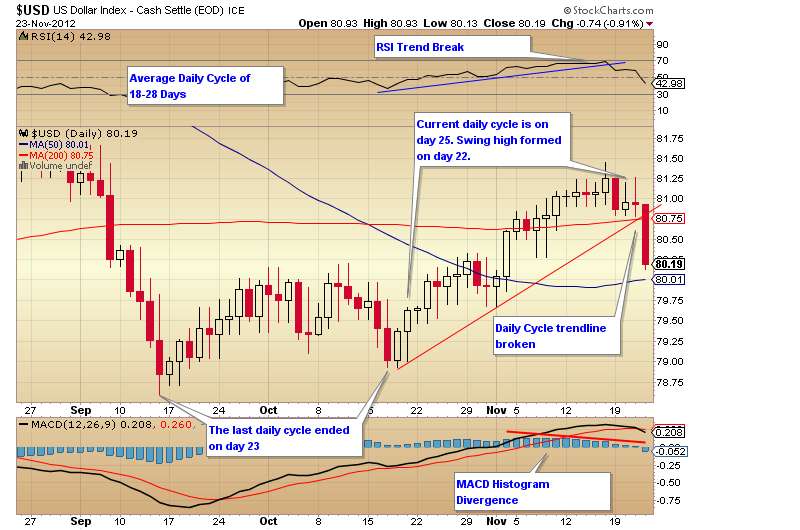
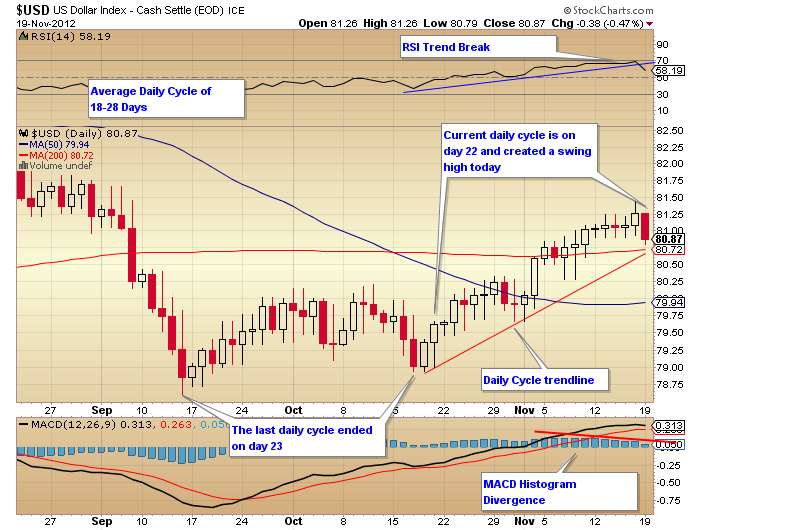
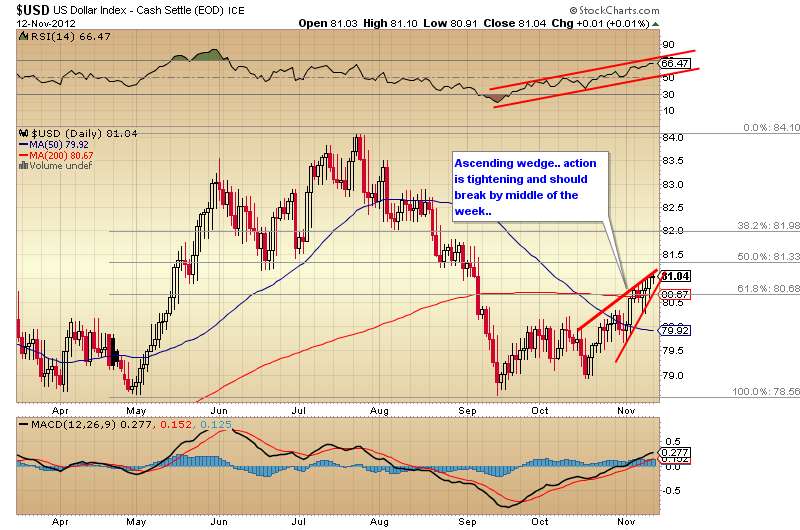
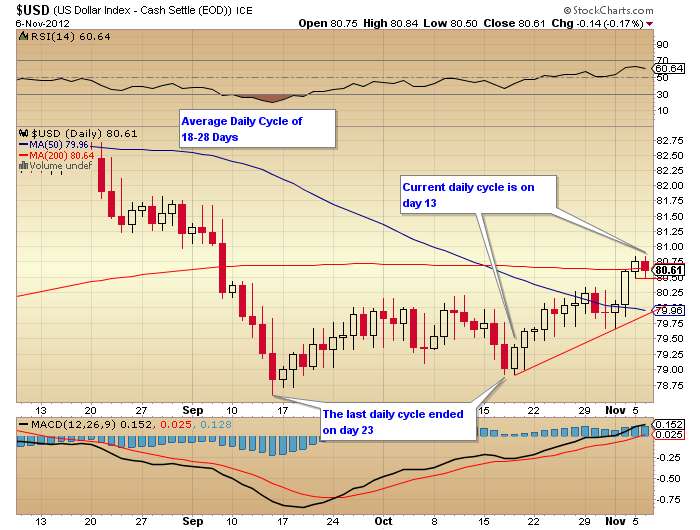
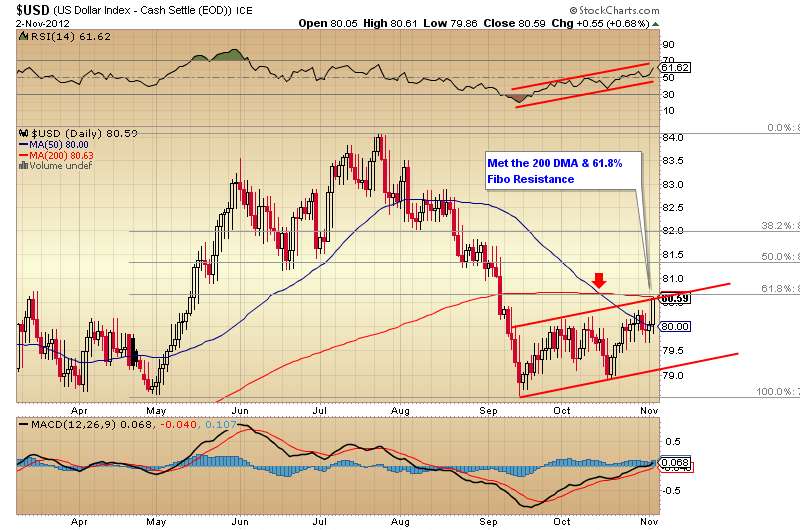
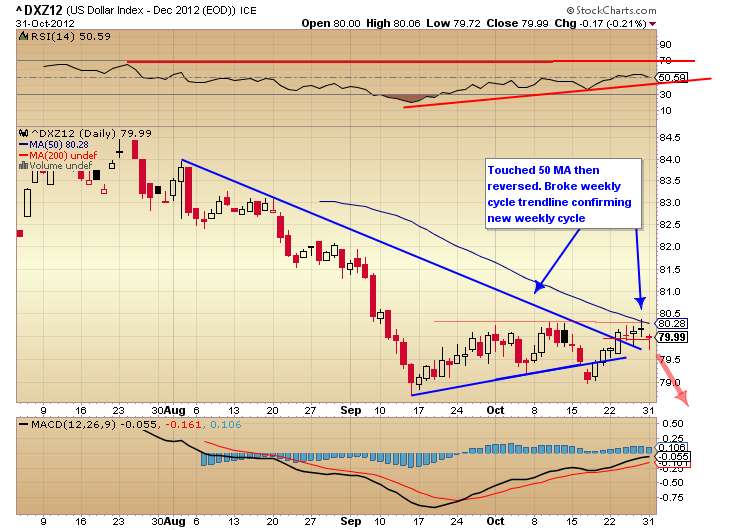
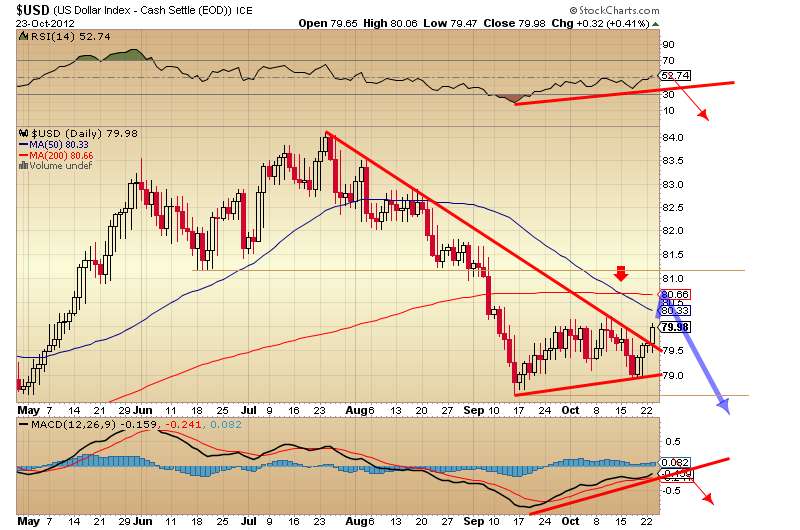
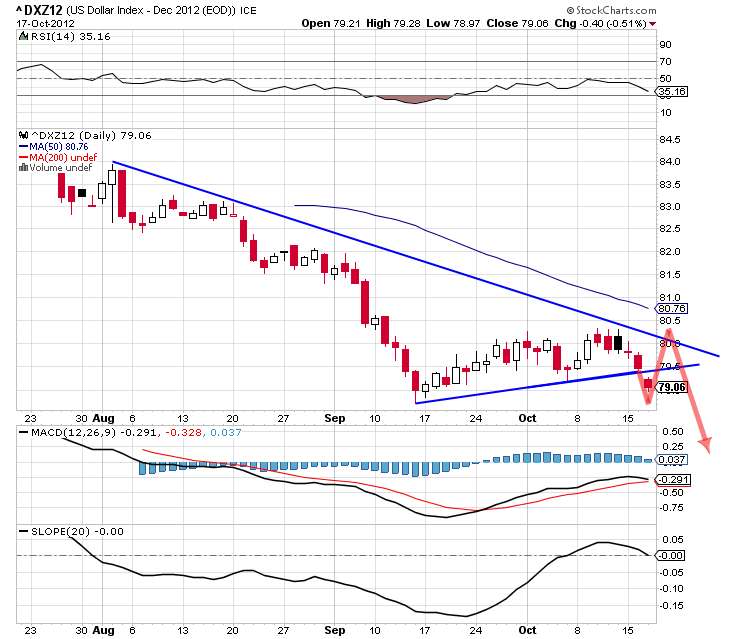
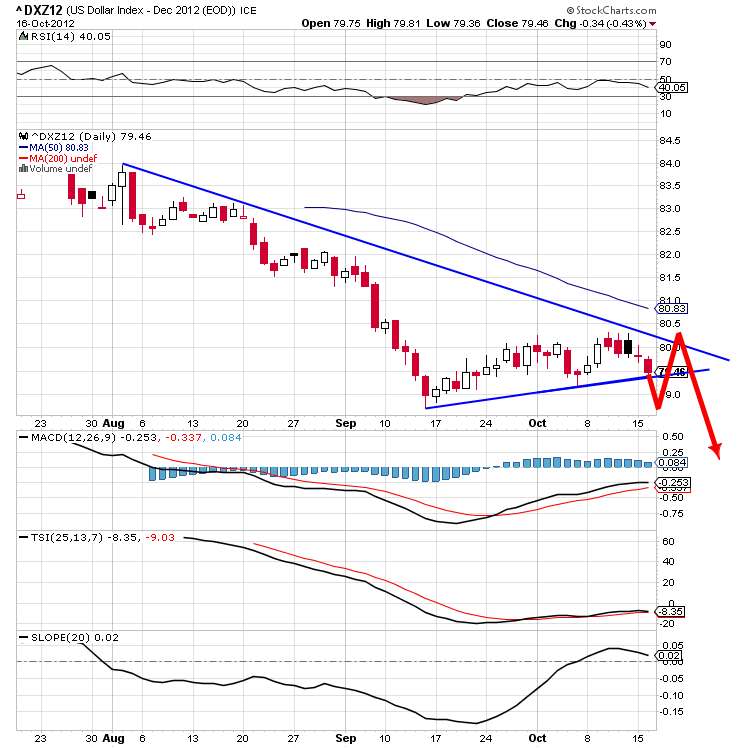
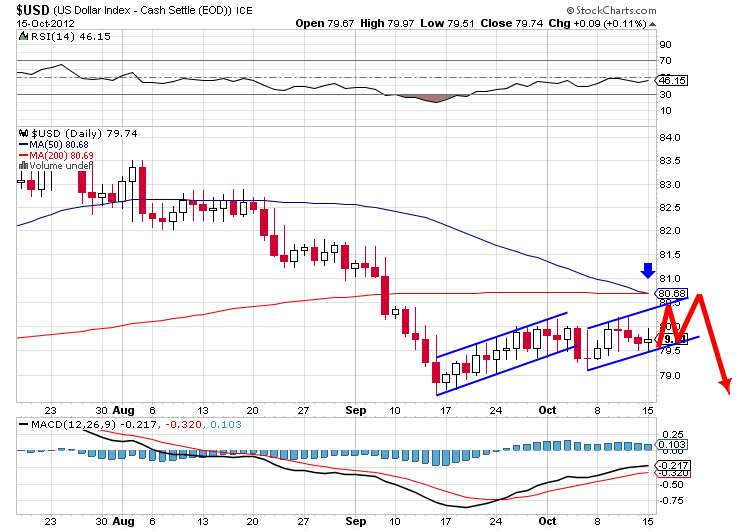
Today was day 25 of the dollar daily cycle. We could still drop for a few more days.. which I think is highly possible. The dollar hasn't really found any significant technical support at the level where it currently sits. I'd think the price could move below the 50 DMA at $80. If so, I'd highly doubt a big move back above it on the next daily cycle rally. Take note of how the MACD histogram did a great job of predicting a downturn before it ever got here. There was a clear divergence and now we're seeing it reflected in price.


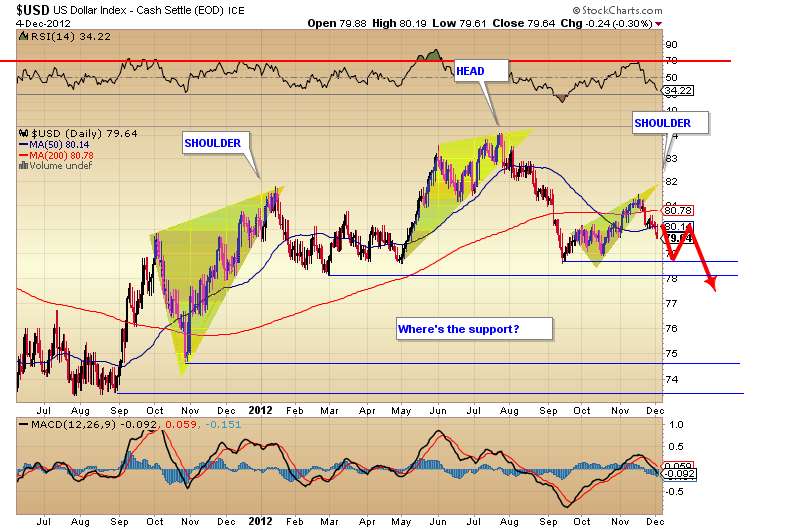
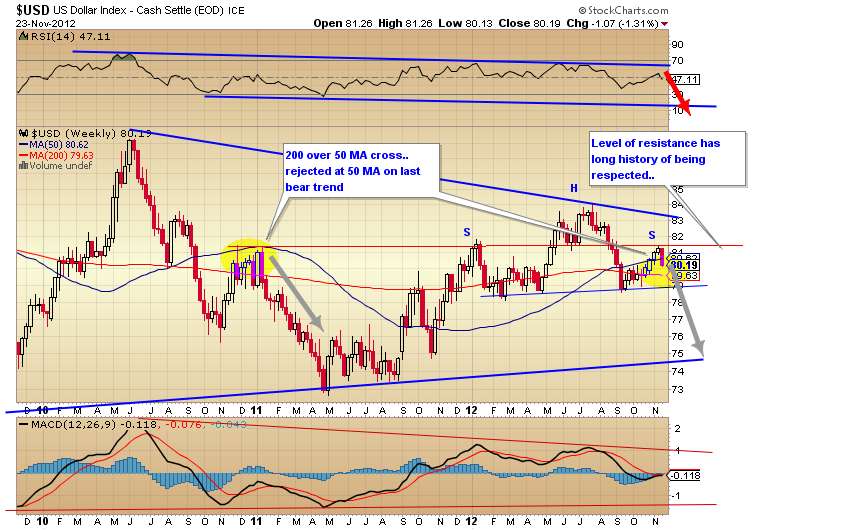
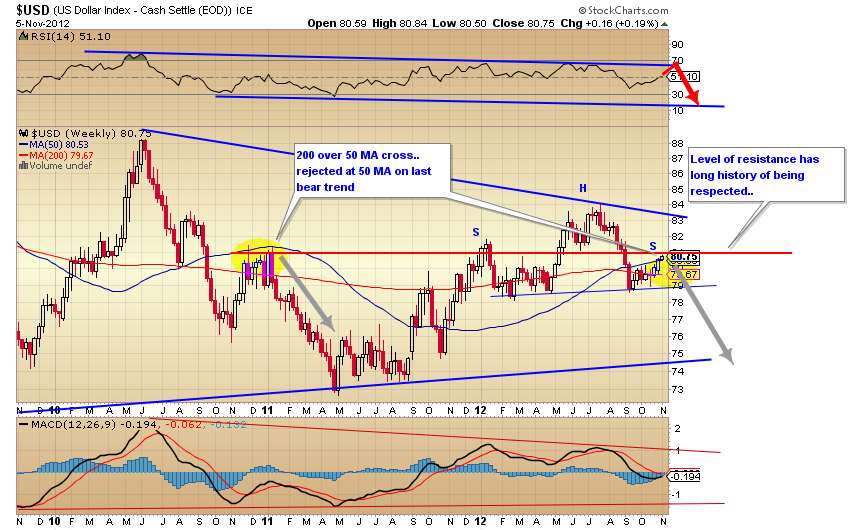
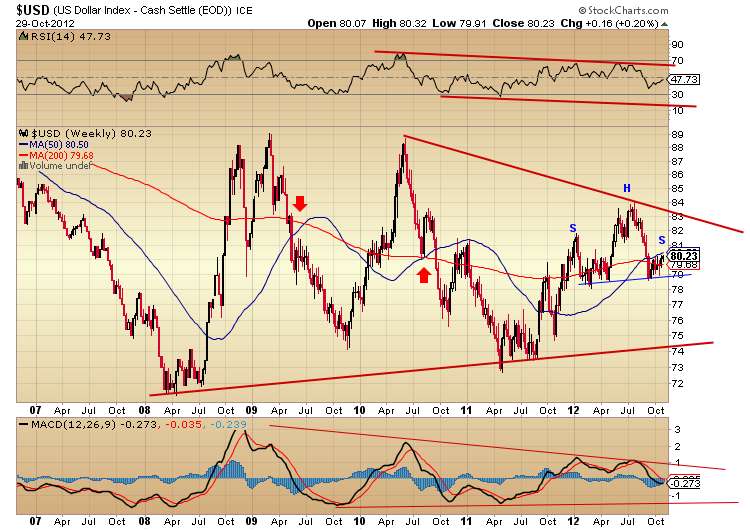
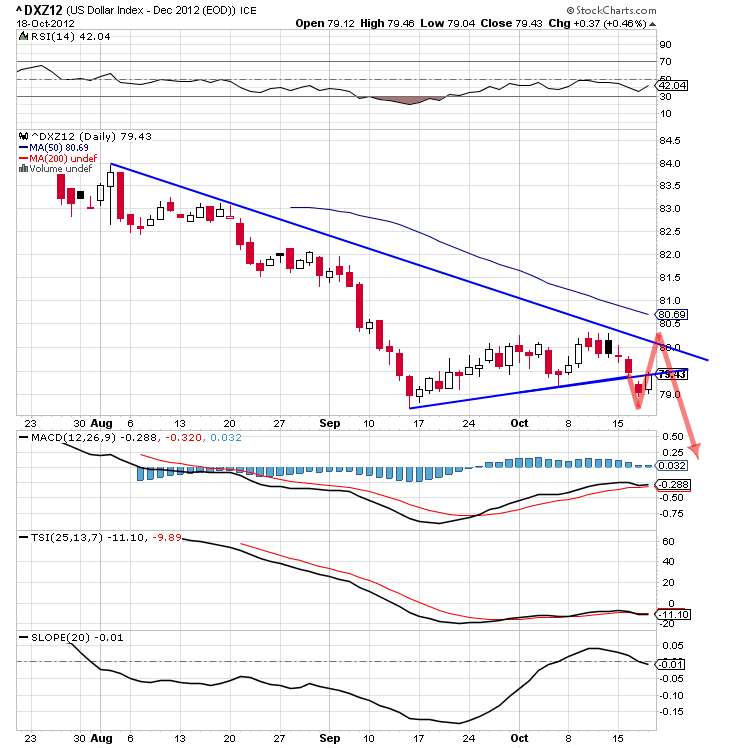
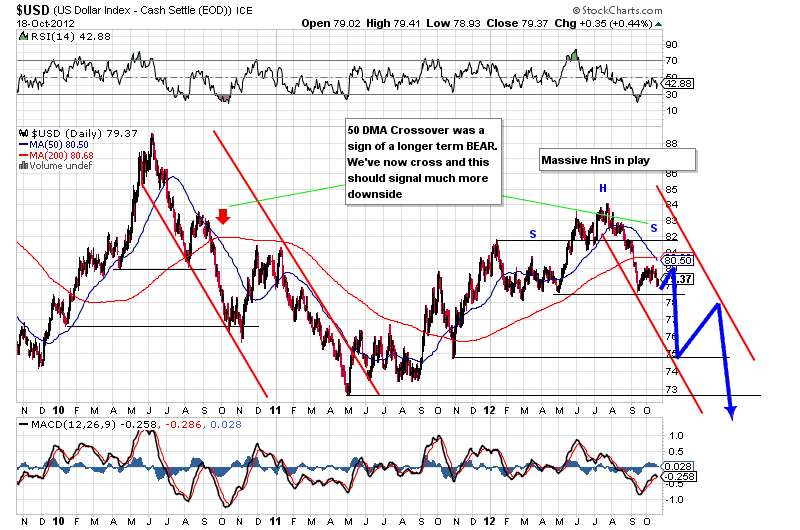
The next daily cycle for the dollar is in big trouble. We're due not only for a weekly cycle low, but we will also be in the timing band for a yearly cycle low after the new year. I expect all new rallies from the coming daily cycles to be short lived. Even if we get bad news out of the Euro, the rallies should be sold and reverse quickly. In my opinion, this is about as bearish as a chart can get. Once that $79 area neckline is met, lookout below..


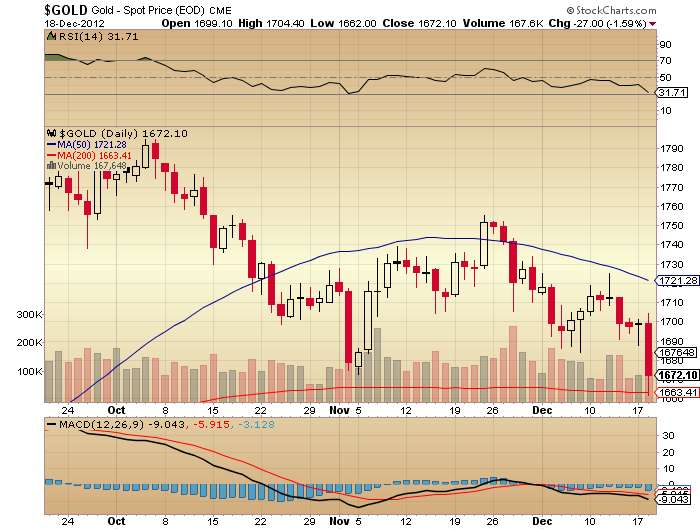
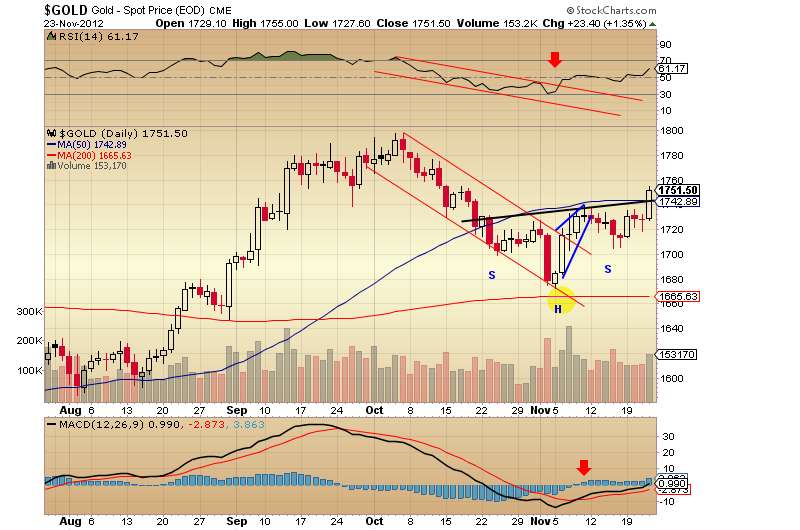
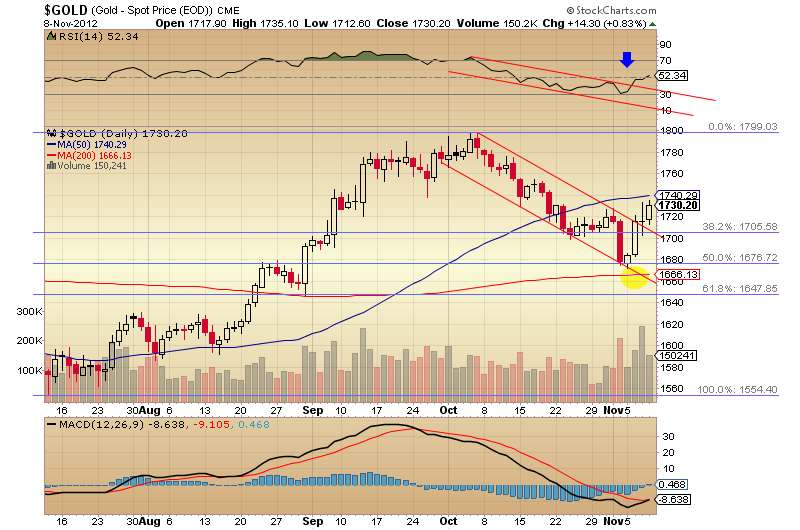
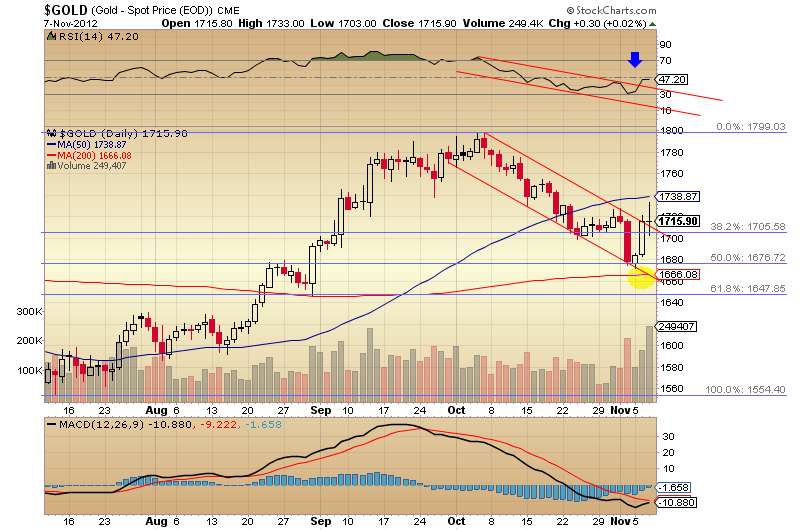
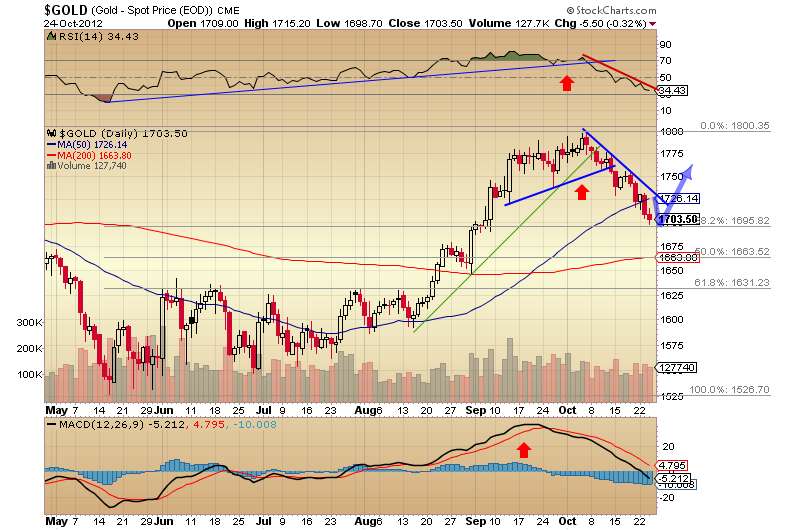
Gold rallied strong today. It has broken the neckline of the iHnS.


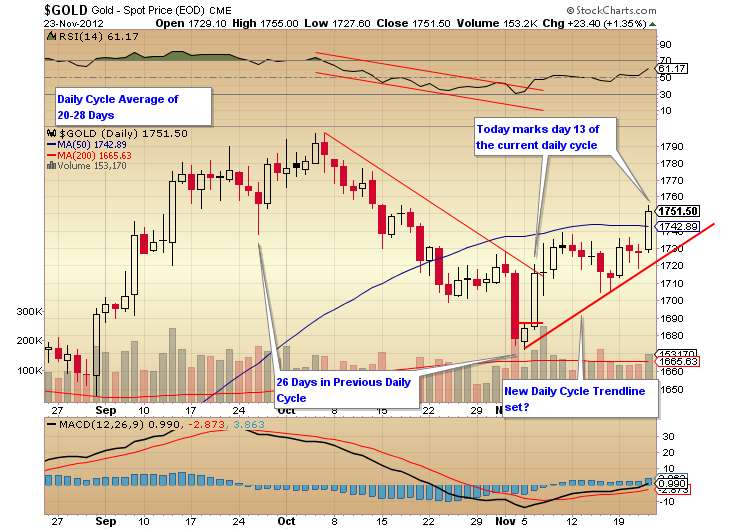
Today is day 13 of Gold's daily cycle. We've also broken above and closed above the 50 DMA. And not shown on this chart, is that gold's close on the week shows us a weekly swing low. This is very bullish.


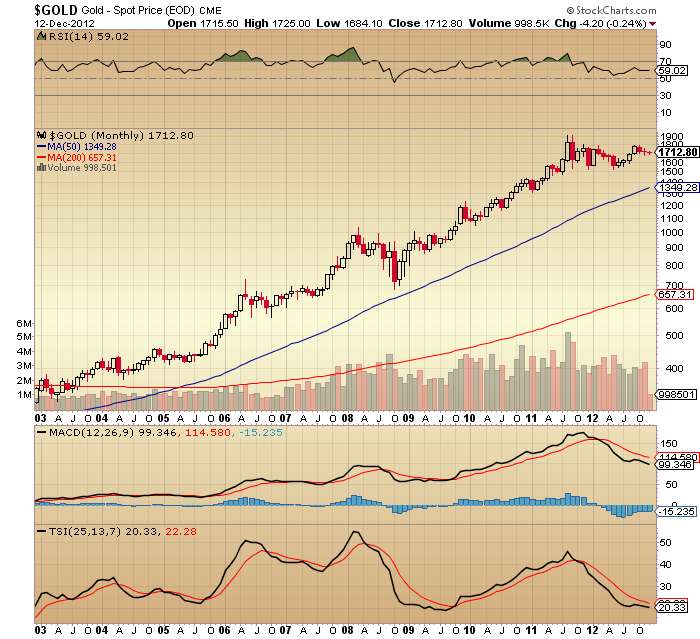
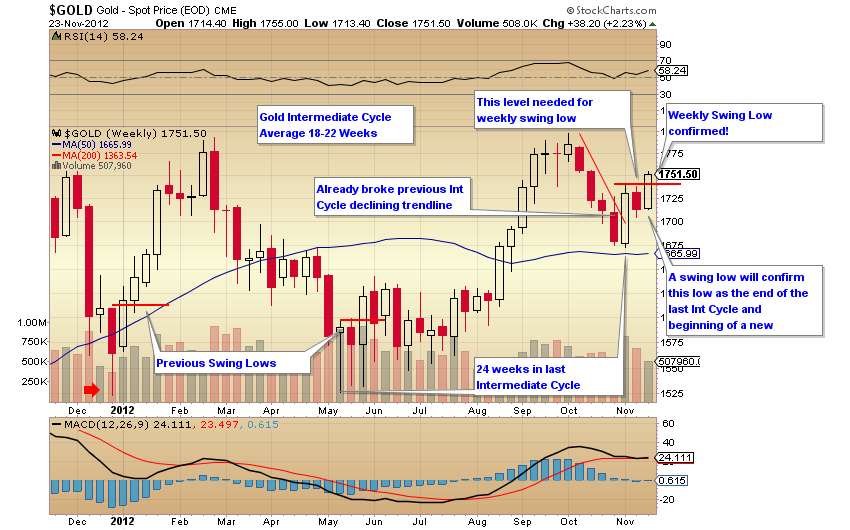
Here's a look at Gold's weekly swing low..


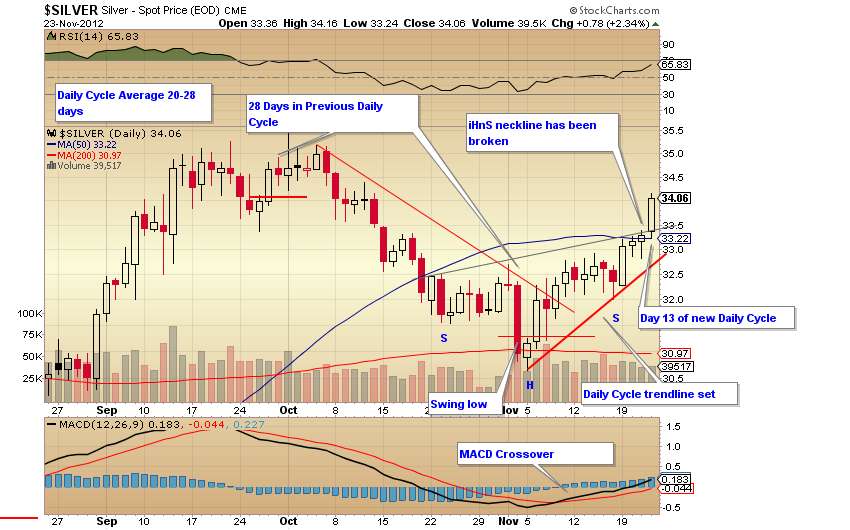
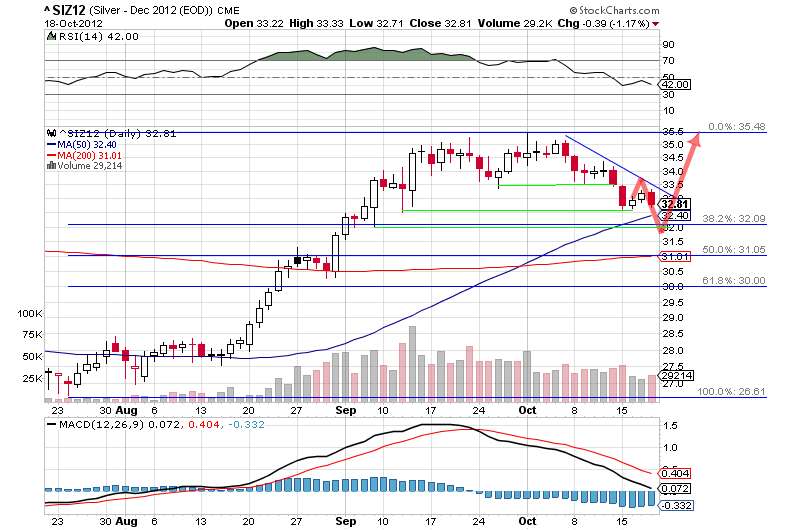
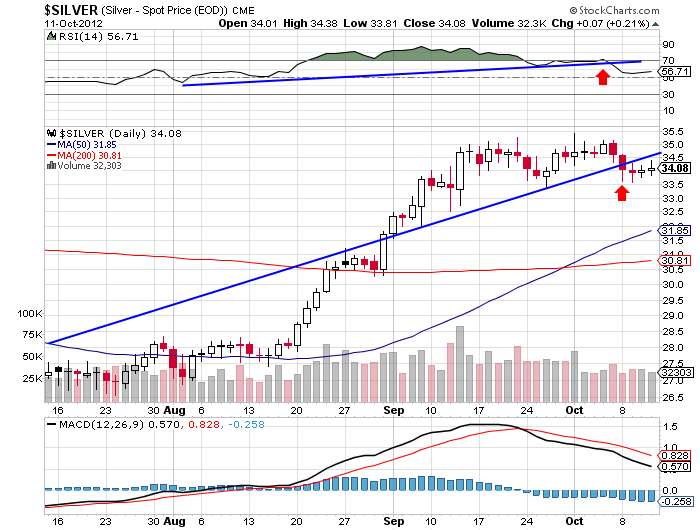
The same is true for silver.. iHnS neckline break, 50 DMA taken back, and weekly swing low formed. I expect both metals to top out in their daily cycle this week (bullishly right translated now) as the dollar continues to search for it's low. Once the dollar bounces for a few days, the metals will correct and digest a bit of these big gains and begin to move into it's daily cycle low.


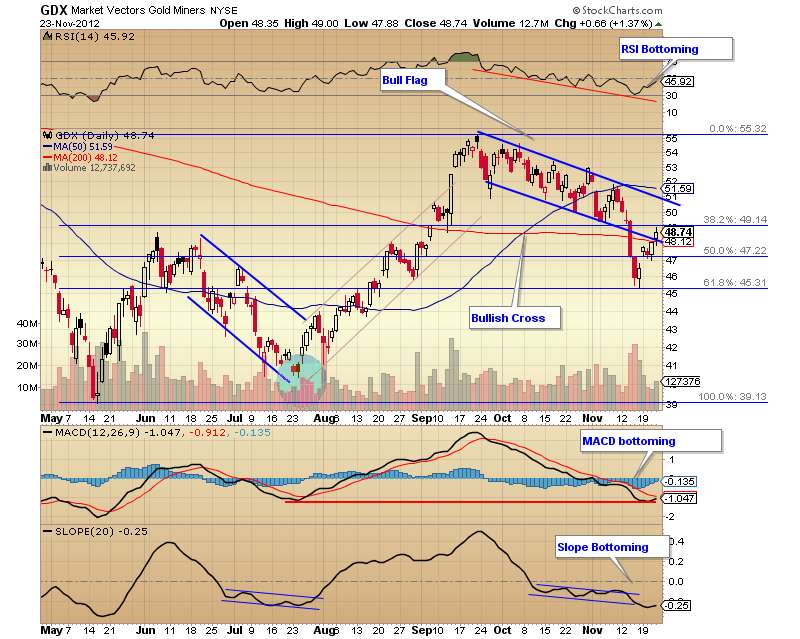
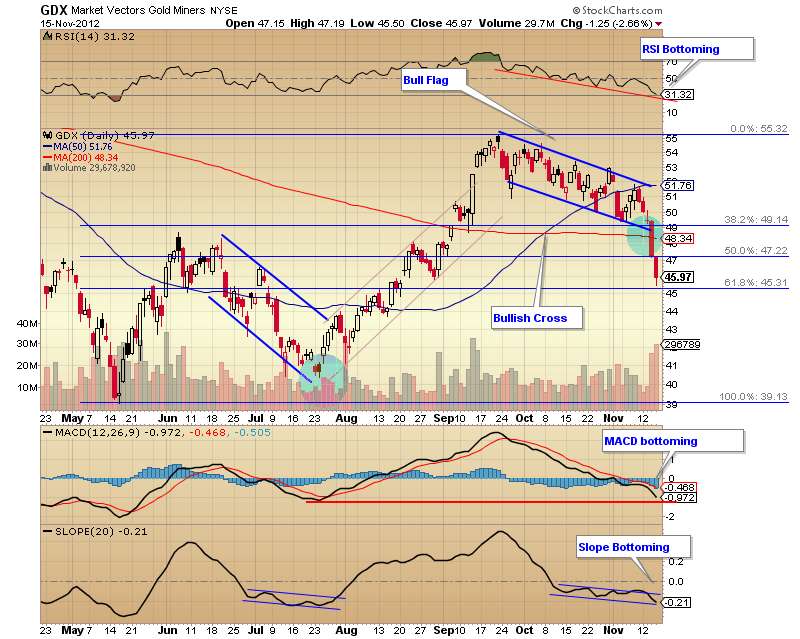
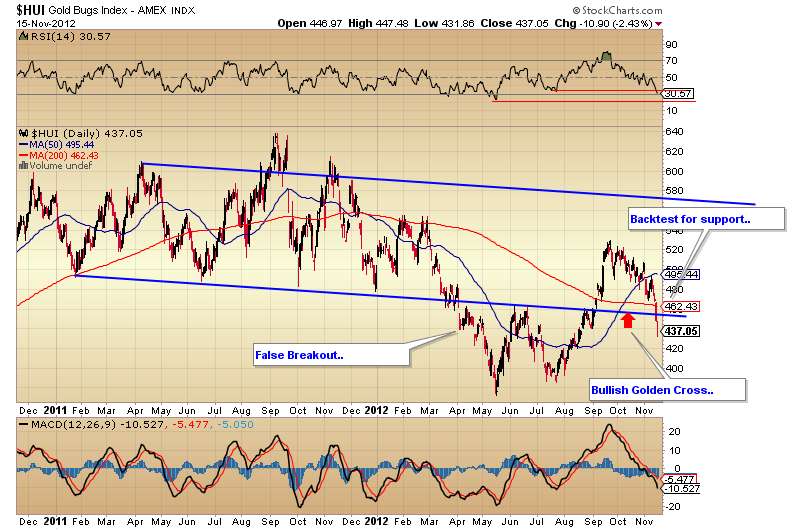
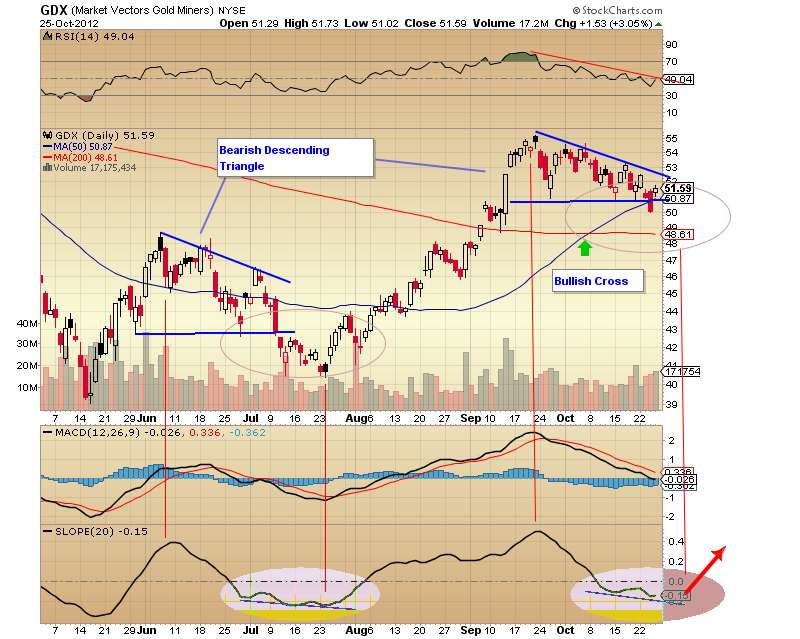
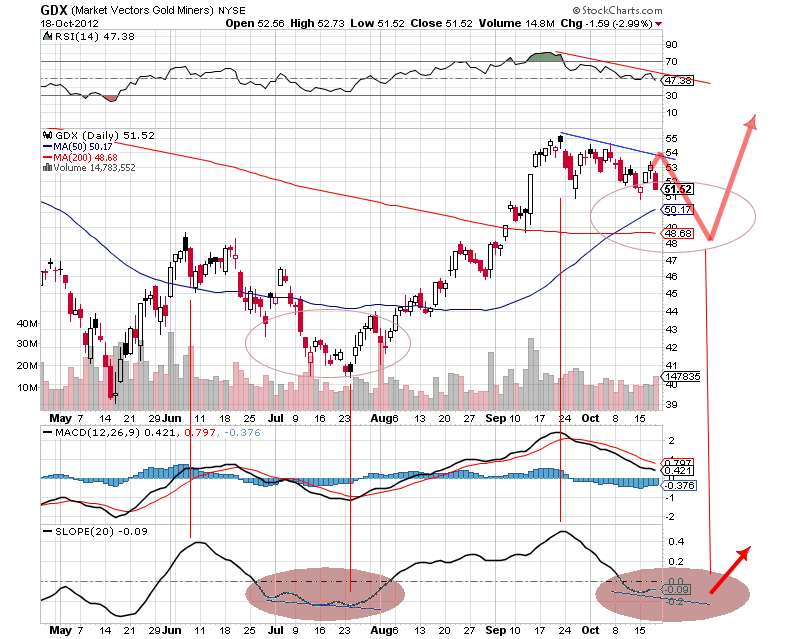
The Gold miners in GDX had a great day as well. They have all but completely erased the thrashing they took last week. We've regained the 200 DMA AND the bull flag. That means that the breakout of the price below the bull flag was a false move.. and in the technical world, a false move is often met by a fast and aggressive move in the opposite direction. Let's hang on and see where this goes. The next daily cycle decline in the dollar should set these miners on fire and break this bull flag for good!


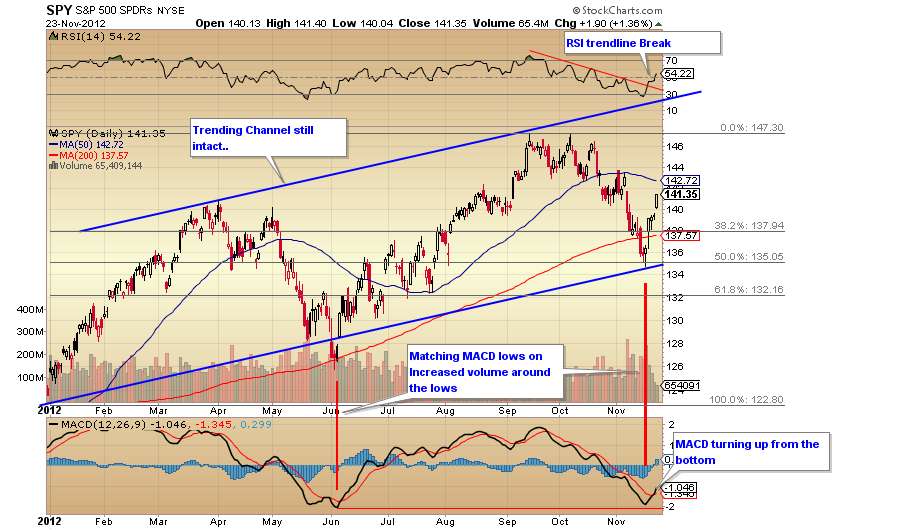
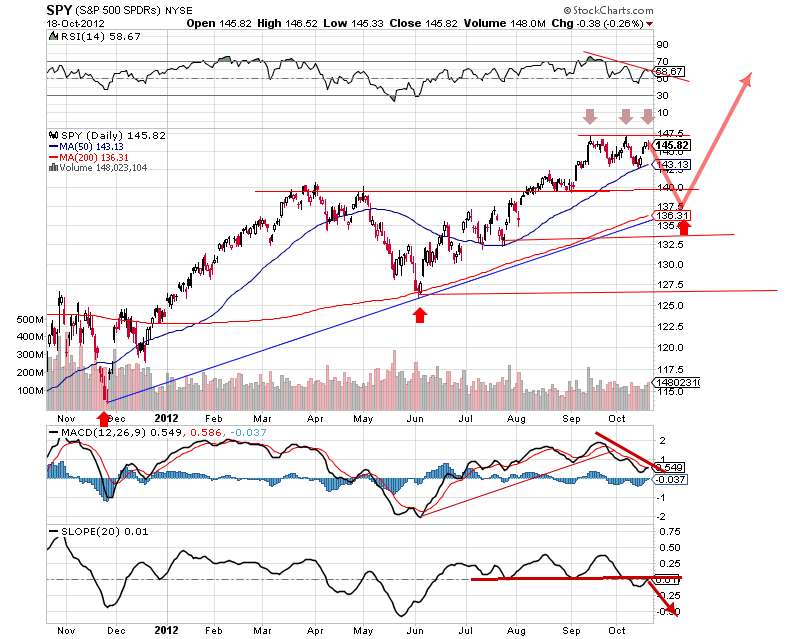
What can I say about stocks? They have posted fantastic gains out of this intermediate cycle bottom. The indicators have all turned up and we've had strong buying action for 4+ days now. The 200 DMA has been regained. Once the 50 is regained, look out..


Things are about to get really interesting..


Monday, November 19, 2012

Nov 19, 2012

Since I didn't get to post a weekend update, we have a lot of catching up to do. The markets turned last Friday, showed us some positive, and followed through today. I got home from work early today and turned on CNBC. Those guys are idiots. They talked all day about this political reason or that fiscal cliff.. blah blah. Never once did they mention the US Dollar and the value of equities or metals being priced in those dollars. This is why we follow cycles. It cuts the noise and keeps us on track. Those guys really give me a foggy mind.

The dollar put in a big top last Friday. Price shot all the way up to $81.50 to be very quickly rejected. We've since fallen back under $81.. a more than 50 cent drop in one trading day. Let's first recall what cycles we count so that I can paint a full picture for you here. The smallest cycle we follow is the daily cycle. The next largest is the weekly or intermediate cycle, and the final is the yearly cycle. There are also other cycles created by the yearly, but those are different depending on the asset being discussed.

The dollar's current daily cycle is on day 22. They normally last 18-28 days, so we are in the timing band for a daily cycle low. I expect the dollar to decline for another 4-5 days. Once that bottomed is formed, we should see another small rally to signal a new daily cycle.


Thursday, November 15, 2012

Nov 15, 2012

Whew, another day where Mr. Market shows us his strong hand.

Stocks continued to sell off today putting tremendous pressure on the metals miners. I honestly have no idea what is driving this tremendous selloff again today, but I can assure you, whatever it is, it's completely irrational. The talk of fiscal cliffs and US downgrades have made stocks a risk and year end liquidations have been creating selling pressure. In the meantime, the metals themselves have shown tremendous strength amidst all of the madness in equities.

Normally Metals and the miners trade fairly parallel. In other words, when gold goes up, so do the gold miners. There are only a few exceptions when this has not happened before. The last time was in 2008 when the country entered a recession. The spread was also very extreme this past summer when miners launched out of their bottom. So, where do we stand now? At nearly the same extreme spread.

I believe that the miners, which were already grossly undervalued, are now extremely drastically undervalued. Gold prices have gone higher while the miners have gotten crushed. Remember what I said about the rubber band? These miners will snap back with a vengeance. Also remember what I said yesterday about weak hands being pushed out and smart money entering at these discount prices? Soros didn't get his BILLIONS from being a weak hand in the market. He was a buyer today, and so was I.

Soros Adds to Gold Miner ETF Positions, Raises GLD Stake

The November filing indicates Soros has more than doubled his GDX stake to 2.32 million shares and now holds a sizable chunk of call options on the ETF as well. 


Here's a look at the $HUI. There's a fairly large channel that we've been oscillating in and out of. Perhaps this irrational selling will be countered with enough buying to catapult the price back into the range. The bullish MA cross leads me to believe this could be the case. The only problem.. is when. As you can see, we broke below this range before. We tested it on 3 different occasion and were unable to break back through it. After one more dip.. the next push went back into the range. WD Gann says that past resistance, one broken, should become support. Now is time for that test.. but not without a little pressure to scare you out first.


Wednesday, November 14, 2012

Nov 14, 2012

Wow what a day! There's been lots of screaming, cussing, and folks thinking the market is going to crash and their lives are over. The white flag has been waving..

So tomorrow I buy.

We've always been told to buy high and sell low. But does anyone stop to ask, "What is high and what is low?" Such a silly question.. but isn't it the most important?

This is low.

First off GDX. Miners got HAMMERED today! I sat back watching in joy as others spent their day wiping sweat from their forehead from anxiety. I didn't buy near term options on purpose. My GDX options are for March. I mentioned a couple of weeks ago that my target price for those March 54 options would be $2. I instead got anxious, broke my own rules, and bought in early. I only ended up with 7 of the intended 10 call options and paid $2.70 for them. Today they traded at $1.30. I'm in the red.. but I'm not worried. Time is on my side and I'm still confident in the fundamentals. Miners are grossly undervalued at this point in time.

What happens when you stretch a rubberband?

What happens when you stretch it really tight?

GDX found perfect support on the 50% fibo today. This is a decent step below the 200 DMA. I'm still not worried.. weak hands are being flushed by the dozens while smart money steps in to scoop up the cheap prices. This is the name of the game.

Watch for a quick snap back into the trading range very soon..


Monday, November 12, 2012

Nov 12, 2012

I skipped the weekend update because there wasn't much to update on. Only a few minor developments to note today.

First up.. Dollar.

The Dollar has formed a fairly large ascending wedge. This is a bear pattern and I mentioned it for the first time last week. As the action gets tighter, it forces a decision to be made. There are a lot of technical buyers and sellers (including programmed) in the market. A break either way is usually a strong one. The majority of the time, this formation is a very bearish one and breaks to the downside.


Thursday, November 8, 2012

Nov 08, 2012

Tonight's blog is brief.. only a couple of important factors to cover.

First off, gold. What does this chart tell us?

- 50 DMA over 200 DMA "golden cross".. extremely bullish
- RSI Broke resistance
- MACD has now given us a buy signal by crossing over
- Price has broken the declining cycle trendline
- Price bounced off of the 200 DMA as support

Now tell me what is bearish in this chart? Exactly, I don't see anything either. Hope you got your tickets for this ride.. it's already pulling out of the station!


Wednesday, November 7, 2012

Nov 07, 2012

Just a quick update tonight..

Gold closed outside of it's trading range today. This falling trendline is the daily cycle trendline. Aside from the swing low formed yesterday, this was the next indicator we needed to confirm a new daily cycle is in effect.. the trendline break. Today would be day 2 of this cycle. This is a very bullish development for gold. The next big step will be forming the weekly swing next week.


Tuesday, November 6, 2012

Nov 06, 2012 - Election Day

Today was election day. From early this morning, the markets began to speak. Metals rallied, the dollar began to falter, and stocks rallied. I mentioned yesterday that there could be a lot of volatility today.. and we got it.


First off, the dollar fell from it's highs. Yesterday could have very well been the daily cycle top. If that is the case, in order to confirm it, we need to create a swing high and fall back below the daily cycle trendline. That swing high was not created today. My stockcharts price showed today's candle low at the exact price as the low of yesterday's candle. Tomorrow will give us the story.


Monday, November 5, 2012

Nov 05, 2012

Quick update for tonight.. as markets were fairly quiet today.

Of course the big story is the move in the Dollar. It's continued to rally pushing other assets down. I believe this rally is very short lived now and will show us a quick reversal very very soon. It's right up against the 50 DMA. It has already stretched well above the 200 DMA. We have seen a "death cross" of the 200 DMA over the 50 which has always signaled a 3 year low. We have a very large HnS formation which is tremendously bearish and we're right up against a long term point of resistance that has always been respected. Could the dollar paint a more bearish picture?


Saturday, November 3, 2012

Weekend Report, Ending Nov 02, 2012

This week ended with brutal selloff after the NFP numbers were released. The NFP caused a spike in the $USD, which conversely triggered a massive liquidation in metals. The dollar finished up .65% on the day. Gold was down 2.24% and silver fell down 4.39%.

This massive spike in the dollar has caused me to reevaluate our current cycle count. I'll address each individually below in their respective places. Please check the "Cycles" link on the right hand side to see the updated cycles charts/counts.

$USD:

The dollar spiked today to find resistance right up against the 200 DMA and the 61.8% fibo level. I wouldn't be surprised for the trend buying to push it over these levels temporarily to create a short term overbought situation causing a quick liquidation back into the range. Price is also against upper channel resistance.


Wednesday, October 31, 2012

Oct 31, 2012

Today marked day 10 of the new daily cycle in the Dollar. We moved off of the highs in the $80.30 range yesterday to bottom at $79.70 this morning. Price tried to recapture the $80 mark, but has been unsuccessful so far. Before falling, price touched the 50 MA.


Tuesday, October 30, 2012

Oct 30, 2012

The Markets were closed again today but futures continued electronically.

The Dollar is on day 9 of it's new daily cycle. I believe it peaked on day 8. Since that high, we've fallen out of the ascending wedge as I noted on the last post was forming. Once price broke, it fell below $80, and has been unable to regain it this evening. This is a very bearish scenario and anymore selling pressure should get the ball rolling. Over the past 35 sessions, the dollar has closed over $80 only 3 times.


Here's a longer term look at the dollar. You can see the long term channel that we're trading in. After kissing the top of it just a few weeks ago, we're now destined to have a date with the lower end of the channel. This is in the $74 range. The head shoulders is beginning to take shape. The 50MA has crossed over the 200MA. Every instance of this happening in the past has been followed through with several months of selling.


Miners may have a very big year coming up. Here's a look at the $HUI. Take note of the MA crosses. Every single time that we've had a 50>200 MA cross, we've seen tremendous gains. Well, that has just occurred again. That is why I am long GDX.


Metals were largely unchanged on the day. I have a feeling this is coming to a very abrupt ending very soon.


Monday, October 29, 2012

Oct 29, 2012

The NYSE is closed today due to Hurricane Sandy. Most commodities are flat to down today as money flows moved to strengthen the $USD. I am posting this update for this reason, to show you that I believe we are in the last push of this new daily cycle in the dollar. As we are in a an intermediate Bear trend, this should prove to be a left translated daily cycle before leading to the bottom. From a technical side the dollar is painting a very large head and shoulders. Currently, price is right up against the left shoulder resistance as well as the 50 MA resistance. In the second chart below, you can see the very bearish ascending wedge forming and closing in on it's peak. Even though the dollar is testing it's highs again today, metals have yet to put in a lower low or match last weeks lows.


The following chart is a 5 hour current look of the USD. It's noted on the longer term chart above by the red arrow on the right hand side. This ascending triangle is a very bearish formation.


Thursday, October 25, 2012

Oct 25, 2012


Story of the day, GDX.

As mentioned yesterday, GDX broke from it's descending triangle. I mentioned either the breakdown would follow through or it would be a bear trap. Well, GDX opened today with a gap up of 3%. I priced out options yesterday at 3:50pm and realized they were all selling at a deep discount. However, I did not have enough time to pull the trigger. Today all options appeared to be selling at a premium for current underlying levels. Notice how the day's candle returned to the the inside of the formation today. I'd also like to note, that it's typical for a false breakout in one direction to be followed by a large move in the other direction as a counter. Let's see if we get anymore follow through tomorrow.


Wednesday, October 24, 2012

Oct 24, 2012

Just a few updated charts for tonight updating the progress of the dollar top and metals bottom. One thing to note is that SPY topped the list of BOW numbers today. GLD remained in the top 10 and was near the top yesterday.

Money Flows - Buying on Weakness


Gold:


Tuesday, October 23, 2012

Oct 23 2012

The dollar broke it's trending weekly resistance level today. Having just broken this, I would expect a few more days of upward action. However, I believe the moving averages will provide enough resistance to cap the rally. Equities and metals will continue to slide until the dollar tops.


Sunday, October 21, 2012

Weekend Report - Ending 19 Oct, 2012


Charts provided without commentary..

I think there's more squeeze coming in metals. Dollar should rally to about $81 or so and top out against the 200 MA. Look at past rallies and see how the corrections used the 200 as support.. until it crossed. Then it goes back up and tests it as resistance. We've just broken below the 200 MA (along with the 50 MA, a huge bearish signal) so now it only makes sense to top out around that level. Consequently, the 200 MA will be between $80.50-81.00 depending on how long it takes to get there.

This pushes metals into extreme oversold conditions. Silver as low as $30.50 and Gold as low as $1695. 

I don't think the dollar will be able to close above the 200 MA, and if it does, something in the fundamentals will have changed in the short term. Heavy selling should come in at that point.

Dollar Short Term


Thursday, October 18, 2012

Oct 18, 2012

Today was the day we have been looking forward to for a week or so. The Dollar has put in it's swing low signaling a reversal. Today's action closed higher than the intra-day high of yesterday.. thus signaling the reverse in sentiment and it's buying strength. Our next important point to look forward to is back towards the $80 level where the dollar should meet it's multi month downward trend which was set back in August. This should provide enough resistance needed to continue this multi month slide.


Here's a longer term view of the Dollar. Notice that now we've had the 50 MA cross the 200 MA. Also take note of the massive head and shoulders pattern in play.


Stocks weakened today. I fully expected another day or two of upside, but the reversal in the dollar signaled some selling. It's hard to see on this chart, but a big red candle was charted for the day. Indicators are showing weakness. This is a chance for a short term "short" on the S&P before we head to higher highs and eventually landing near $1550 in the spring.


There's not much to add today for silver. Just like stocks, it sold itself a bit short of resistance and put in a swing high today reversing the trend. Next we wait for a bottom. The 38.2 retracement should be good support right around $32 or just under.


Oil seems to be in a sideways consolidation pattern. It is being held below the 50 MA. In this consolidation, we've formed a rough, but obvious inverse head and shoulders. Once we break the trendline and blow the 50 MA, oil should move upward quite explosively. Also notice from the last time I updated oil, I pointed out that the MACD was about to give a buy signal. It has since crossed and more buying should come into play soon, especially once the dollar weakens again.


GDX put in a very aggressive swing high today. The price really dropped. I would love nothing more than to see GDX drop to the 200 MA and give us a buy opportunity around $48. However, the 50 MA could provide support and turnaround right at $50. Either way, I am very big on miners because of how beat down they were after gold and silver's major decline last year. The prices in miners are very cheap in contrast to where they were before the long correction period. This leads me to believe they have a lot of making up to do. With general equities rallying over the next few month as well as gold, these miners should really move. I will be a buyer whenever we confirm a low.


Conclusion - The Dollar should find a top in the next 7-10 days. I really don't see it rallying anymore than that because of the strong multi month resistance. This should push metals and stocks down into weekly lows.. which I expect all to rally out very strongly.

Wednesday, October 17, 2012

Oct 17, 2012

Tonight is an update using the same charts as the ones I used last night. Stockcharts has been agreat resource for me because the underlying data on the chart can continue to update over any edits I have made. This really helps me to confirm trendlines and predicted moves without having to redraw the charts.

For reference, please compare tonight's charts with the charts I posted last night. The only edits I made was to go back into the chart and make the predicted move lines a bit opaque so that we could see the underlying price moves below them.

First up.. the dollar. It's behaving just as I had hoped. It dropped through the daily trendline and has found support near $79. If we do not go lower from here, I expect a few days of recovery with the dollar testing the $80-81 mark again. We've had about a month of positive action, so if we're turned away on the downward slope around $80, I expect a deeper decline to $78.


Tuesday, October 16, 2012

Oct 16th, 2012

Today I needed to reevaluate my short term thoughts on the the dollar. After hours tonight, price has broken much lower going below what we thought could have been a low on Oct 5th. Price is hovering just above $79 right now. The low on the 5th did not confirm as you can see I added the Slope (linear regression) as it is a very good trend indicator and it did not move lower on the Oct 5th low. The slope is very near to turning over and giving a sell signal now confirming that we have a weakened trend and that price will move into a new low. Remember, price always follows path of least resistance. Once we are able to print a daily low in the next few days, we should reverse and then find resistance off of the weekly trendline set back in August at the beginning of this leg down. This high will finish off the lows in metals and signal a reversal.


Monday, October 15, 2012

Oct 15th, 2012

The dollar had another indecisive day today, the third in a row. It's action is very similar to what we saw the last couple of weeks in it's bear flag. I expect a continued trend higher within the channel, until we break.


Thursday, October 11, 2012

Oct 11, 2012

There's not much to update today. I wanted to take this time to zoom in close on silver action and show this specific trendline break. Silver must regain this zone in order to proceed. If not, downside could come at any time. 50 DMA level should provide any downside support.