
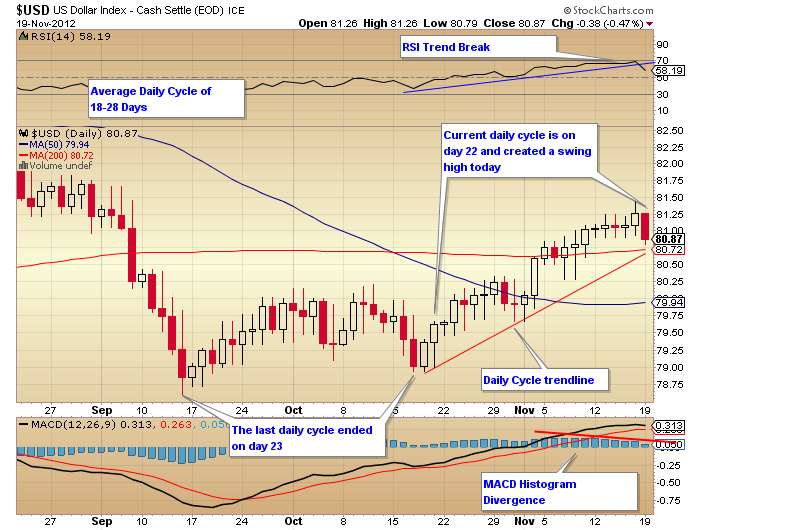
The dollar put in a big top last Friday. Price shot all the way up to $81.50 to be very quickly rejected. We've since fallen back under $81.. a more than 50 cent drop in one trading day. Let's first recall what cycles we count so that I can paint a full picture for you here. The smallest cycle we follow is the daily cycle. The next largest is the weekly or intermediate cycle, and the final is the yearly cycle. There are also other cycles created by the yearly, but those are different depending on the asset being discussed.
The dollar's current daily cycle is on day 22. They normally last 18-28 days, so we are in the timing band for a daily cycle low. I expect the dollar to decline for another 4-5 days. Once that bottomed is formed, we should see another small rally to signal a new daily cycle.
Below is the Dollar's intermediate cycle. We are currently on week 10.. and those normally last 18-22 weeks. So, what I am trying to say, is that the dollar has a long way to fall before we find an intermediate cycle low. It just so happens that the next intermediate cycle low also falls into the timing band for a yearly cycle low.

Here's the long term look at the dollar and it's yearly cycles. I believe the current high has formed the declining yearly cycle trendline.. just like the previous cycles. This year's cycle has been extremely weak and has made a lower high.. and has also created a higher low from it's start. We have a tightening triangle forming here over the long term.. something to keep an eye on. One thing to add.. notice that price is creating higher lows with the yearly lows. However, notice that the MACD is trending downward.. creating lower lows at each yearly low. This is a HUGE divergence.. and must be resolved in time. That gives me a very bearish feel for the USD in the long term.
Also, because we are already in the yearly decline, price can not exceed the declining trendline. For this reason, I believe the next several daily cycles and intermediate cycle will be extremely left translated, pushing price down very quickly.

Gold's daily cycle bottomed back on Nov 5th. Since that low, we have created a swing low, broke the declining daily cycle trend line of the last daily cycle, and we have formed a higher low which sets the new daily cycle trendline. Today is day 10 of the current daily cycle.. with an average of 20-28 days.
To put this into perspective, the dollar is on day 22 and has maybe 5 days left in it's daily cycle to print a low. with gold currently sitting on day 10, we should have another 5 days of upside. This will put gold on approximately day 15 out of 20-28. This will form a bullish right translated daily cycle (more on cycle translations below).
See how these cycles work together?

This is the current look at the Intermediate cycle for gold. Gold needs to form a weekly swing low. We are currently on week 2. Compare the timing of this weekly cycle to the dollar's.. interesting?

Silver is in much of the same boat as gold.

The only difference in silver and gold in the weekly cycle is that silver has already launched high enough to form a swing low. Let's see if we get a close above this level on the week.

The $HUI (Miners) are trying to regain trendline support again. Perhaps they can get back into the channel and regain the 200 DMA again by the end of the week. That would be tremendously bullish.

Here's a look at the Miners ETF, GDX. They bounced off of a logical fibo support and gap'd up at the open today to rest on the next fibo level. Once again, perhaps they can regain the bull flag by the end of this dollar daily cycle low. That will set them up for a huge breakout on the next daily cycle in the dollar.

I believe stock have put in their Intermediate cycle bottom. I expect a rally from these lows through January. It's extremely bullish that stocks have regained their 200 DMA on the second day of the rally from the bottom. Next stop? The top of the channel!
Also, take a look at these weekly cycles. These are absolute perfect examples of right translated bullish cycles!

That's all for now. Here's a description of the left and right translations:
The red triangles are all even. You can see that the bullish side of the "mountain" has price rallies that go up for a long time, then decline for a short time. In other words, they spend more time going up, and less going down. While all of them are the same in length, the amount of time spent going up and down differ. The left translated cycle rallies for a very short period and then declines for a much longer time frame. Now compare those to the charts above.. especially SPY.
Make sense?
No comments:
Post a Comment