
First up.. Dollar.
The Dollar has formed a fairly large ascending wedge. This is a bear pattern and I mentioned it for the first time last week. As the action gets tighter, it forces a decision to be made. There are a lot of technical buyers and sellers (including programmed) in the market. A break either way is usually a strong one. The majority of the time, this formation is a very bearish one and breaks to the downside.
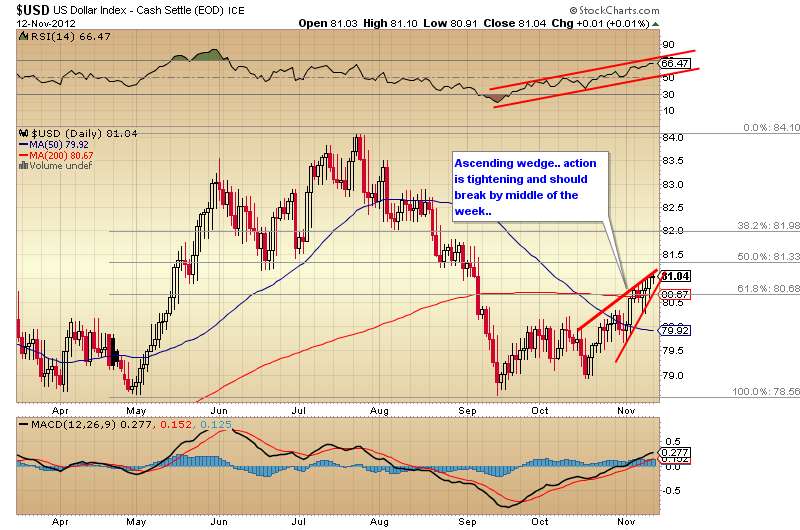
The Dollar is on day 18 of it's current Daily Cycle.

Gold:
Gold is also forming an ascending wedge, but on a much much smaller time frame. I brought this up last week as well. Today's action is confirming a breakdown of this wedge. We should see lower prices throughout the week perhaps testing $1700 again. This will setup a nice iHnS which the technical traders will love.
We have rebounded strongly off of the bottom last week. Now it's time to digest a little bit of that gain. The MACD has shown us a crossover and the RSI has given us a trendline break. These are very bullish developments. This price drop over the next few days will test those breakouts to see if they hold. This is typical action and is expected.

Gold is on day 5 of it's current daily cycle.

Silver:
Silver is behaving just like gold. It's also falling from it's wedge and should form a final low within the week.

Silver's current daily cycle is on day 5.

Gold Miners:
GDX is still on track and is consolidating in a Bull Flag. Bull Flags are very bullish developments. With the dollar possibly making one more push higher and with stock trying to find a bottom, I expect GDX to drop one more time to the lower end of it's trading channel. This will push price as deep as $48. This will be an excellent point to buy and hold going into the new year. Once the bull flag breaks, that will be another fine point to enter any remaining positions.

Stocks:
The S&P still has a little way to go before I would feel confident saying the bottom is in. Support has not been found just yet, but it's coming.. especially with the dollar still hanging on over $81. Indicators are near bottom and price is oscillating near the 200 DMA. A break below to find support on the 50% fibo would be an excellent move for smart money to wash out weak hands and then reverse. Everyone expects the 200 DMA to hold but it's clear that all past corrections have pierced the 200 DMA.. and for good reason. With that being said, $1360 is not out of the question. That should get some heads spinning!

Conclusion:
All hinges on the dollar.. as usual. I expect it to make another push higher, then break down from it's ascending wedge. The should push the metals and markets out of their bottoms. if the dollar delays a few extra days, then do not worry. The longer the correction.. the more anxious the market becomes causing the upcoming breakout to be even stronger. Patience.. patience.
**
Also, another thought to mull over in the coming days..
Chart analysis is the result of investors worldwide all buying and selling. As a result, we see their "thoughts" on paper in chart form. I think it's very important to understand this. I tend to not view chart analysis as "price analysis". Rather, I view it as "mass psychology" analysis. When you can understand that, and put yourself in the frame of mind of everyone else viewing the same chart, it becomes easier to find advantages to outsmart the other.
The market is a game of fools.. and only the smartest of fools can survive.
No comments:
Post a Comment