
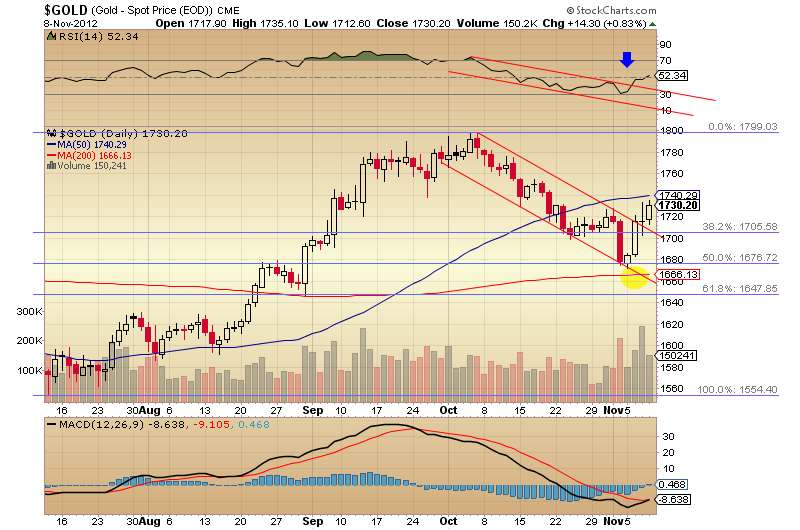
First off, gold. What does this chart tell us?
- 50 DMA over 200 DMA "golden cross".. extremely bullish
- RSI Broke resistance
- MACD has now given us a buy signal by crossing over
- Price has broken the declining cycle trendline
- Price bounced off of the 200 DMA as support
Now tell me what is bearish in this chart? Exactly, I don't see anything either. Hope you got your tickets for this ride.. it's already pulling out of the station!
What about the Dollar?
It's forming a fairly large Ascending Wedge. This is a very bearish formation. Price targets are calculated by the lowest point of the price touching the wedge, and the high of the wedge. That gives us a target of under $79.

Stocks fell more again today. If we can finally get down to that 200 DMA and bounce, we'll be in good shape. There were more HUGE BOW numbers today. That's always a good sign that smart money is moving back in.

GDX is showing tremendous strength even though stocks are weak. Good sign? If we can get above that 50 DMA or even trade sideways for a couple of more days, we'll get buy signals in the indicators. MACD is very close now.

Silver looks good like gold. MACD tells us to buy today.. so does RSI. Looks like comfortable support off of the 200 DMA and the 50% fibo.

Looks like we definitely have a daily cycle bottom and start of a new daily cycle here. No doubts anymore. This should also confirm our intermediate cycle.
Next few weeks should be very exciting. I expect some "digestion" as we mull over this explosion out of the bottom. We also have to wait for the dollar to roll over. Once it does, and stocks rally from the bottom, the metals will be on fire.
No comments:
Post a Comment