
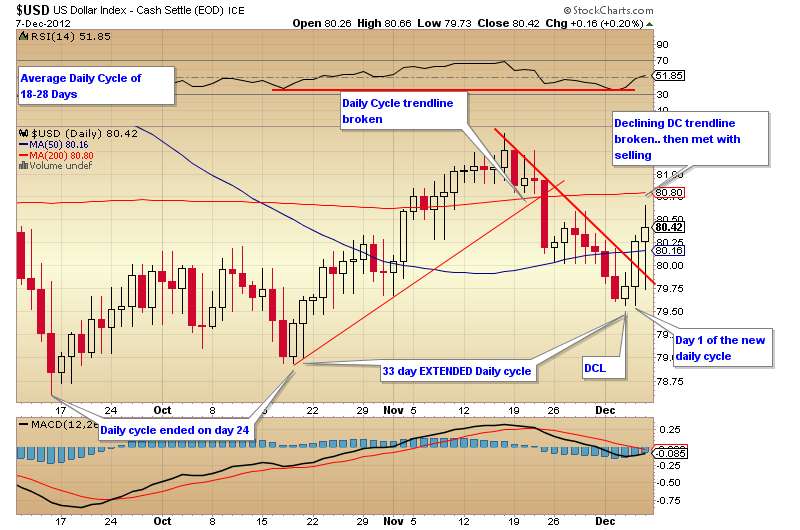
The dollar has thrown us several curve balls over the last couple of weeks. At first we thought we had a cycle bottom. It was then confirmed by a swing low on DAY 1! Also on the same day, the dollar reversed and sold off even harder creating a swing high and beginning a new decline! This lasted for only 7 days before creating another low. Since then, the dollar has created a swing low and broke the declining daily cycle trendline. The difference is, this time it was confirmed by a follow through. Since we had that "fakeout" daily cycle in the middle, we had a lot of confusion. But that "fakeout" only lasted for 7 days and no daily cycle has ever been 7 days. Therefore, the previous daily cycle was an EXTENDED daily cycle and bottomed on day 33.
The dollar's weekly cycle is now starting week 13.. week 12 has just finished. The average intermediate cycle in the dollar runs 18-22 weeks. This gives us 6-10 more weeks to find an intermediate cycle low. With the dollar IC forming a high on week 9, that gives us the formation of a left translated cycle. This is bearish and tells us that our IC is in decline. It's also an indication that our yearly cycle is in decline. As the next IC bottoms in the dollar, we'll also be in the timing band for a yearly cycle low. 6-10 weeks from now puts us in the time frame of end of January into middle of February to finally find a low. That is, as long as the dollar action remains BELOW the declining yearly cycle trendline.

Here are a couple of longer looks at the dollar..


Gold:
Gold has been in a daily cycle decline for the last 10 days. Friday's action printed the lowest low so far. Once that low was in, buying stepped in and forced the price all the way up above the declining Daily Cycle trendline. A swing low has not happened yet, but this was a nice setup to achieve one on Monday. If we do achieve this over the next couple of days, we'll have confirmed a daily cycle low and a new daily cycle.

Gold's intermediate cycle just finished week 4. The previous IC topped on week 20 with the average cycle running 18-22 weeks. The last IC ran 24 weeks total. I'm curious to see how the IC plays out this spring with the dollar coming into the timing band for a yearly cycle low.. as I expect the dollar to give us a big rally out of that low.

Here are a few technicals for gold. We lost fibo support last week, which induced a Bollinger Band crash. Once buying stepped in on Friday, we were able to close back above that fibo support. That long candle shadow on the underside of Friday's candle is a very good sign that bulls have decided to step in at these levels and support the price.

One more look at gold.. long term. Notice the correlation of this long term correction to the last long term correction we had back in '08. The price lost traction above the 200 DMA and consolidated below it for a period of time. It then regained traction and gave a big push back over the 200 DMA only to fall back and use it as support. This is textbook technical action. The same situation is occurring now as we have gained traction back over the 200 DMA and are currently forming a double bottom off of it as support. That was followed by 2 years of higher highs.

Silver:
Silver is in much the same boat as gold. We MAY have seen a high enough price on Friday to give us a swing low, but I'm not 100% convinced of it just yet. I'd like to see prices rise just a little bit more to fully confirm. However, we have clearly broke the declining daily cycle trendline.

Here's a look at silver's intermediate cycle.

Gold Miners:
The miners are a sort of hybrid trade. I say this because they are an equity like any other stock, but they are also tied to commodity prices. Therefore, they get tugged by the action in both sectors. These do not always align, so we get price action that seems wild. This makes it hard to track cycles. Therefore, I do not always count cycles in miners, but I associate them more with my analysis on the metals and stocks.
With the expectancy of metals and stocks to both be rising in the coming weeks, GDX should be a leading indicator for us. This is especially true with how price has been pushed down so far. My personal goal for GDX that I am anticipating in my trading is appx $53 by mid January.

The $HUI is showing us some positive divergences. While price has been driven lower for a double bottom, we have seen the indicators turn up. This should show us some positive price action coming very soon.

Here's a look at the GDX daily cycle. Thursday could have been our DCL if we can confirm that by a daily cycle trendline break.

GDX has double bottomed at an important fibo support and closed back inside it's trending channel.

This is a look at the current and previous Bollinger Band crashes. This week should definitely show us positive price action.

And just for fun..

Stocks:
Stocks just put in an intermediate cycle low. This current daily cycle is the new daily cycle of a new intermediate cycle. We're currently on day 14. Friday's action showed us closing over the 50 DMA. During the Intermediate Cycle decline, we lost traction above the 50 DMA. During that decline, price tried to regain the 50 DMA and was declined.. therefore becoming resistance. We have since bottomed and price has made it back over. You can clearly see the buying support that showed up when price backtested that level on Nov 28th.

One could continue to be long the S&P as long as this daily cycle trendline remains in effect. A break below will signal a turn into our daily cycle decline. The current daily cycle is on day 14. This is also a new Intermediate cycle.. as the last daily cycle low was also the intermediate cycle low.
If stocks can regain the $1420 level here, it may be a long long time before we return. This has been an important pivot in the past. Friday's action closed nicely back over the 50 DMA. This is bullish short term.

Let's hope everything cooperates here as we move into the end of the year. I'd like to see a nice "Santa Claus" rally for Christmas. I'll be able to finally see some green in my GDX calls.
Disclosure- At Monday's open, if silver continues to look good overnight, I plan to enter a long SLV position. I also plan to add one final tranche to my GDX March calls.
**Remember, these reports are my opinion only and should not be used for your own personal trading. I am not a licensed broker and my analysis does not guarantee anything. Trade at your own risk.
No comments:
Post a Comment