
There are many rumors flying about the blogosphere currently about why metals have corrected along with the dollar. I'll leave it up to you to find these and figure out which myth makes the most sense to you. It's in my best interest to try and ignore the noise and keep track of our cycles.
Sentiment has been very low since this breakdown in metals has occurred. This must mean that a bottom is very near.
There are several ways to approach what has happened. I'm not going to present all theories here. It's too time consuming and exhausting. So, I'll cover what I think is going on with the cycles and we'll use that framework as we move along into the new year.
One other thing I want to mention before getting started on the charts is the odd correlation of the US Dollar and gold. These two normally have an inverse relationship. As of the last couple of weeks, gold and the dollar have both been in a decline. Why so?
Looking back through the charts and doing some comparisons, this has only happened a few times before and under only a very precise set of circumstances.. Intermediate Cycle Lows. I didn't take the time to write these dates down exactly, but it occurred just after the new year in 2011, summer 2010, and summer 2007.
***
First off, the dollar is in a current left translated daily cycle.. which has also failed. It is a failed daily cycle because price during this daily cycle has traded lower than the DCL ending the last daily cycle. Today marks day 10 of the dollar daily cycle. This leaves us 1-2 weeks where we can seek out a low.
In the meantime, we have to remember, nothing goes straight down without a bounce.. not even the $USD. We've currently found support at the $79.0x area and buying set in to give us a long shadow on today's candle.

On a smaller time frame, you can see this bottom playing out. Perhaps a very small iH&S has formed which will push us back to the $79.60 area which was used as support for several days before breaking down. It's fairly textbook to go back and retest this level to see if it gives some resistance.
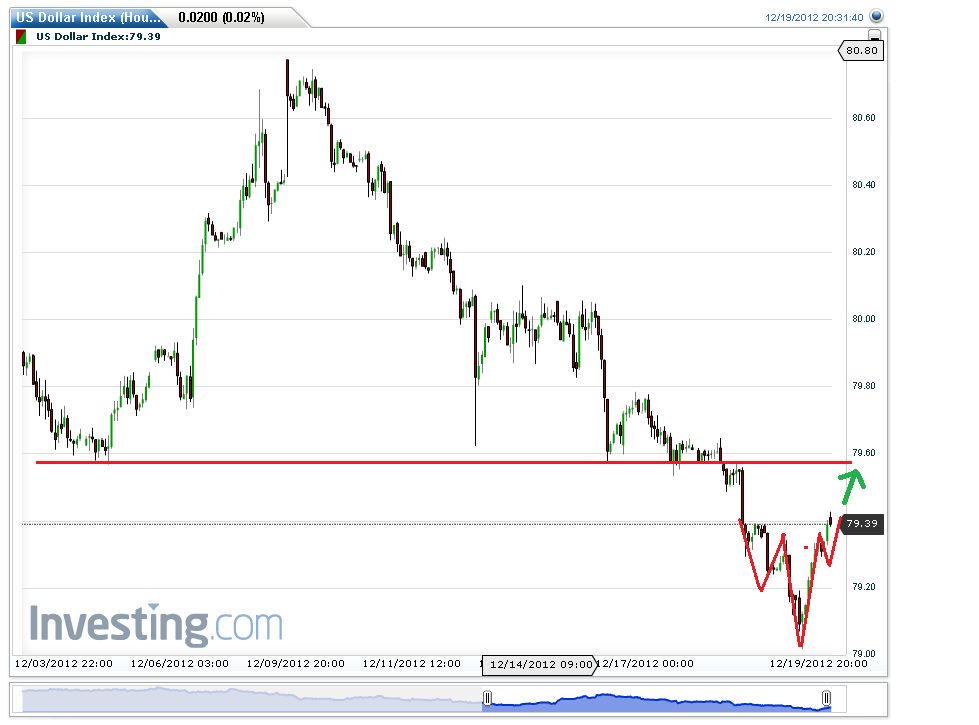
The intermediate cycle is continuing to play out as we expected. Price has now closed below, and stayed below the 200 DMA at $79.51. This is very near the $79.60 area mentioned earlier so there's a good chance price will find resistance there.

Gold is giving traders fits right now. To the best of my understanding of cycles, and to the best of my ability to logically think through this recent drawdown, I think what we are seeing is an Intermediate Cycle low. As you recall, we had initially thought that the low on Nov 5th was our intermediate cycle low. So now we have broken below that level. The bull is not dead and we're not in any type of yearly decline.. so that breaks the idea that this is just a failed daily cycle. Normally those only occur during larger cycle declines. Instead, we just have two left translated daily cycles to end out the previous intermediate cycle.
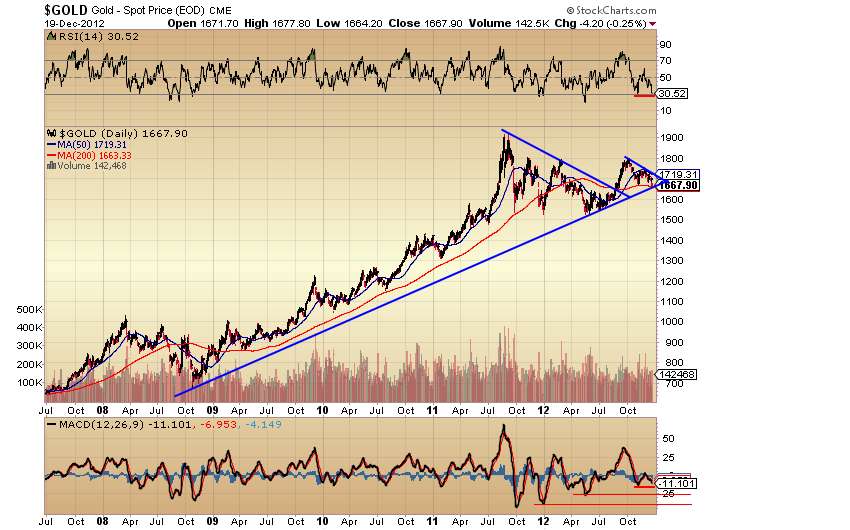
Notice on my DC chart below.. the highlighted area was a sort of "fakeout" DCL. That puts us on day 31 for gold's daily cycle and it is my belief that we are now seeking out an intermediate cycle low.
Notice below how the "fake" ICL on Nov 5th didn't quite touch the 200 DMA. Apparently someone, or several someones with lots of money, has decided that it was necessary to tag this level of support before moving forward.. IF indeed we do move higher from here.
With that being said, it would be nice to see one more small push lower to break the 200 DMA. This will give us a lower target for creating a swing low. As it stands, the low came on Tuesday, and the top of the candle is all the way back up over the $1700 handle. That is a big move for a swing. I also say this because ICLs are known for their violent see-sawing that knocks traders out of their positions. I fully expect some whip-saw action around this level for perhaps a couple of days until a resolution for direction is found.

This is a look at the IC. Notice how this IC has lasted 30 weeks now. As long as this IC stays above the previous ICL at ~$1525, it's not a failed IC.
Also note, this IC peaked on week 20. This gives us 10 weeks of decline. This is right translated. In order to turn this IC into a left translated cycle, we'd have to extend out to 41 weeks. This is not possible, therefore, regardless of how much longer this drags on (realistically), this IC will still maintain a bullish posture (and as long as it stays above the previous IC low as mentioned above).

A few technicals on gold here. There's a rough descending wedge right now. These are reversal trends and statistically speaking most often resolve to the upside. It's also important because the current level of support is right on the 50% fibo level of this entire uptrend. This is a normal and fair level for a correction to reach.

This is a long term view of the major trendline driving gold right now. I've connected the major bottoms of 2008 and 2012. Price action is currently resting very near this support. Maintaining this level is very bullish. As you can see, as history shows, once price action leaves this level, it is a very long time before it returns.
Same trendline, closer view.

One more view of the same trendline, just a bit closer.
Again, we have a long term trendline, a 50% fibo in place, and the 200 DMA. If we can't bounce from these levels and attack $1700 in the near future, we could have more to worry about in 2013.

GDX is working on a possible triple bottom. These are very rare. I won't bore you with the specific details of what the implications are of a triple bottom, so I'll link you to probably the best resource. but I will say, Triple bottoms are considered reversal patterns similar to a head and shoulders, just without the large head in the middle.
Technically, GDX is in trouble if we fall through this support. We've already fallen through the 200 DMA and we've also fell all the way down to the 61.8% fibo. A break through here could easily see us back to the $41 range. I don't see this is logical EVEN with the decline in metals. The Gold:Miner ($GOLD:$XAU) ratio is still very high at 2008 levels.. meaning miners are way undervalued.
This fact, along with what HAS to be an ULTIMATUM with a triple bottom.. should be the perfect launching point for an explosive rally. Not only because miners are due.. but also because metals are due for a big rally out of their ICL very very soon.


This is long winded enough for a weeknight, so I'll stop here for now. To summarize everything I have missed, silver may have a little bit more to drop over the next couple of days. Stocks are soaring higher although the VIX is rising, which could indicate some price movement coming up. SPY topped the BOW list today with big numbers. Stocks should test old highs in January. It is my belief that as stocks test these highs, and break to marginally new ones, a lot of new traders will enter the market. However, we could be due for some very big cycle lows this spring. This could be an ultimate sucker move. A whole fresh pile in of new traders and new long positions thinking we're going much much higher could end up causing such liquidation needed to create the deep lows needed for huge yearly lows. Trade carefully in stocks when we reach those levels.

Thanks to all for taking the time to read my thoughts. Also a big thanks for any new readers who are just signing up. I hope that a new year brings us some fresh market liquidity to get this gold bull roaring again. It's been a long correction since the top in 2011.
Happy Trading!
~Brad
No comments:
Post a Comment