
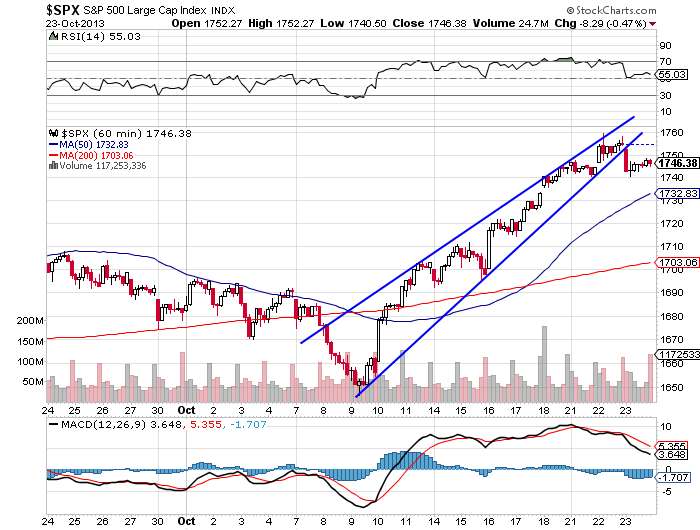
S&P - SPY - 1 hour chart on the S&P is showing a breakdown of an ascending triangle. I'm assuming the first target will be the 50MA.
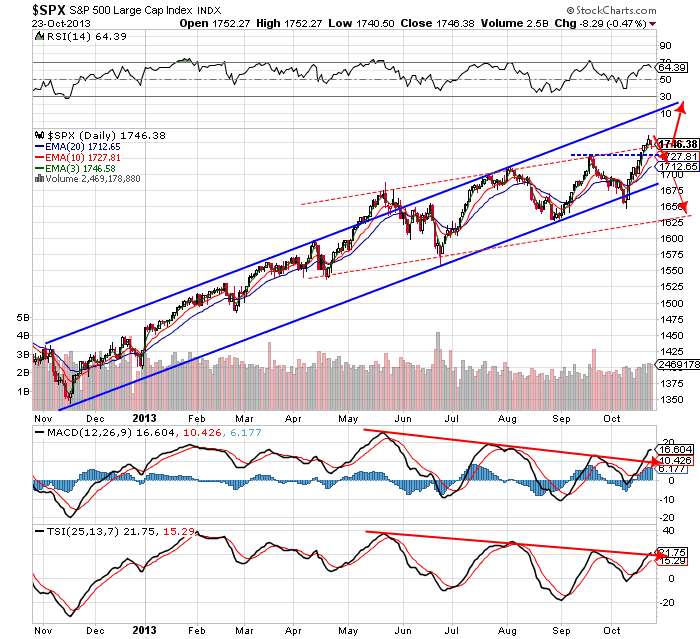
Here's a longer term look at the S&P. Which trend lines will prevail here?
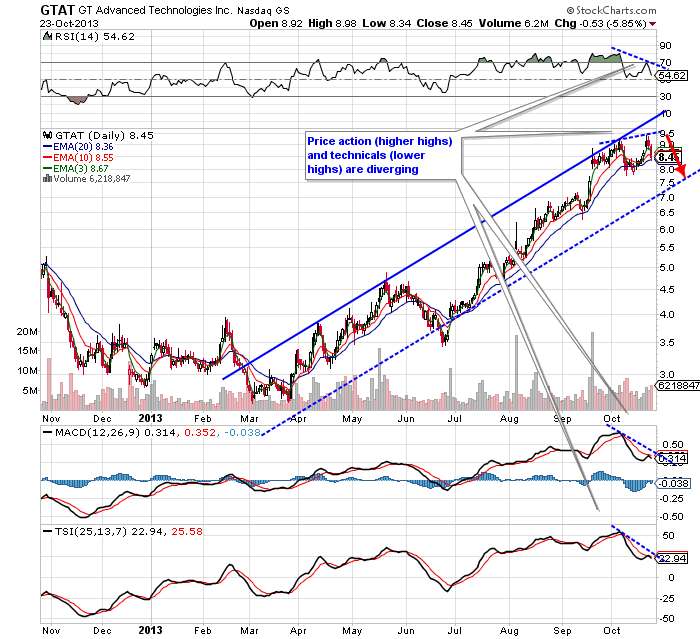
GTAT - Gtat showing some negative divergence between price and indicators. Price set a higher high but all indicators set a lower high. Is this a sign? A test of the bottom of the current trading channel should be in the cards here.
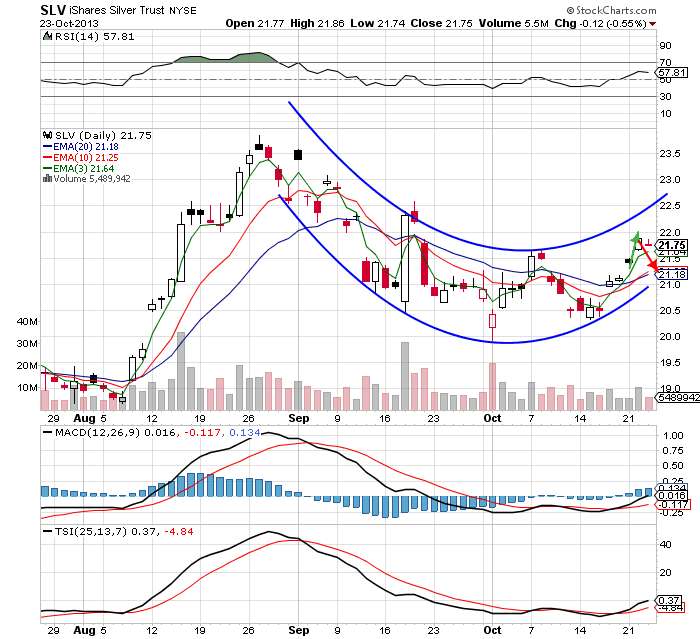
Silver - SLV - SLV is chugging along bouncing around inside this bottoming channel. I'd like to see a little breather now and then a push to the topside of this channel over $22.
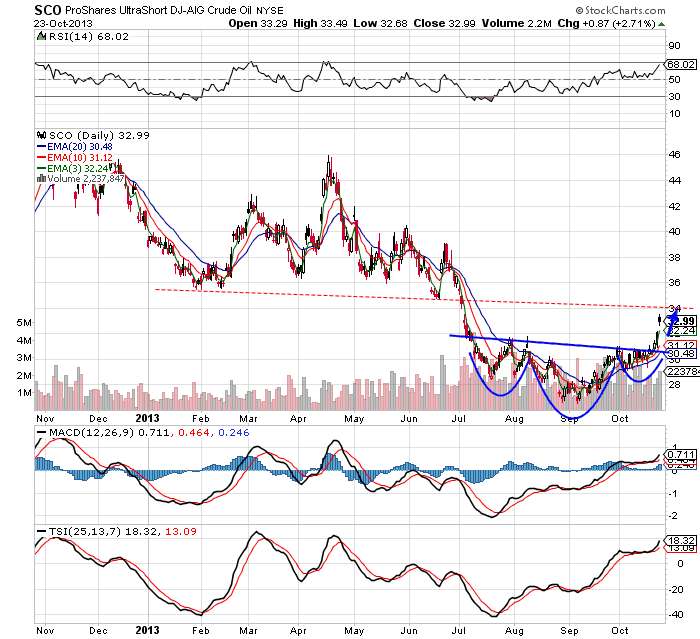
Inverse Oil - SCO - This has been a fantastic trade on an almost text book breakout.
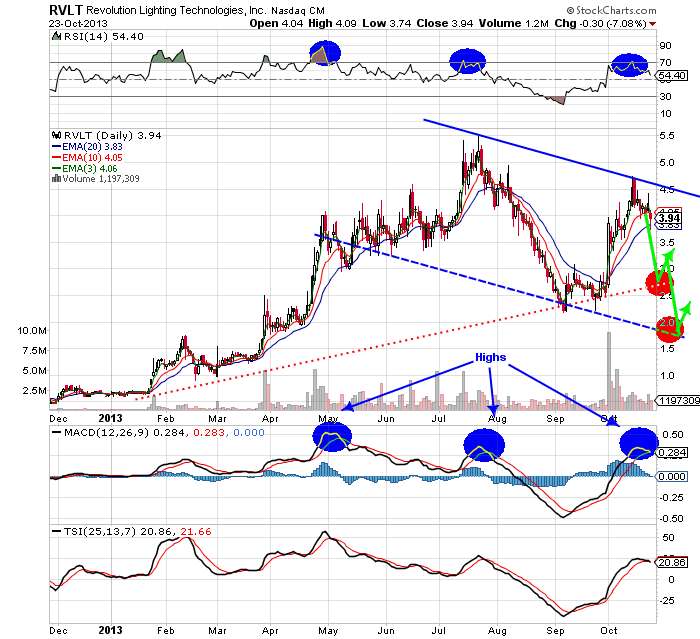
RVLT - As shown a few days ago, RVLT was showing signs of weakness. We've now seen some follow through to the downside. The only question that remains is where the bottom will be. TSI has shown a crossover and MACD is very close.
Have a great night!
No comments:
Post a Comment