
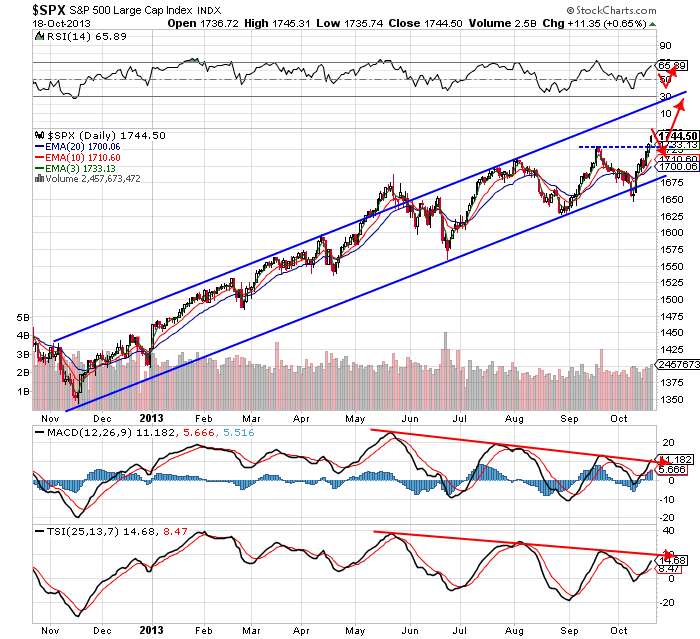
S&P - SPY - I expect a breather this week after such a sharp incline. Key things to notice is that the new surge in price broke out over the previous high. This usually signals more buying to come. And as always, higher prices can be confirmed by a quick back test of the break out level. Resistance turns into support. Indications of a short pullback.. RSI is high, and the 3/10/20 is at a deep spread. Also, not annotated on this chart, but price is currently above the upper Bollinger band. Reasons to believe higher prices are to come? Prices have broken to new highs, MACD is possibly breaking a long term trend, and as always.. a trend is a trend, until it's no longer a trend. Don't fight it.
One thing to be concerned about? The huge negative divergences on the MACD and TSI. they're making lower highs.. rather than higher highs like the price is. Another concern is the length of time that it's been since there was a meaningful correction. The continued higher prices without correction is reminiscent of a blow off speculative top. When this up-channel breaks, look out below..
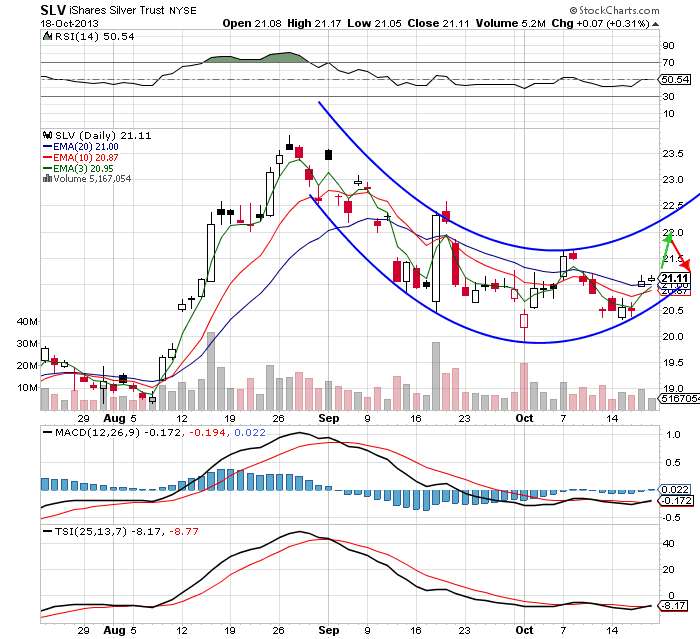
Silver - SLV - This is just another view of silver from the last post. I wanted to display the rounding/bottoming action. RSI has been flat.. not sure I've ever seen this before. MACD and TSI look to be turning up and showing a buy along with the 3/10/20ema crossover. I'm curious to see if price action continues to roll around this semi-circle and push up to the $22 area before coming back. With the EMA giving us a buy signal, this could be a nice short swing trade.
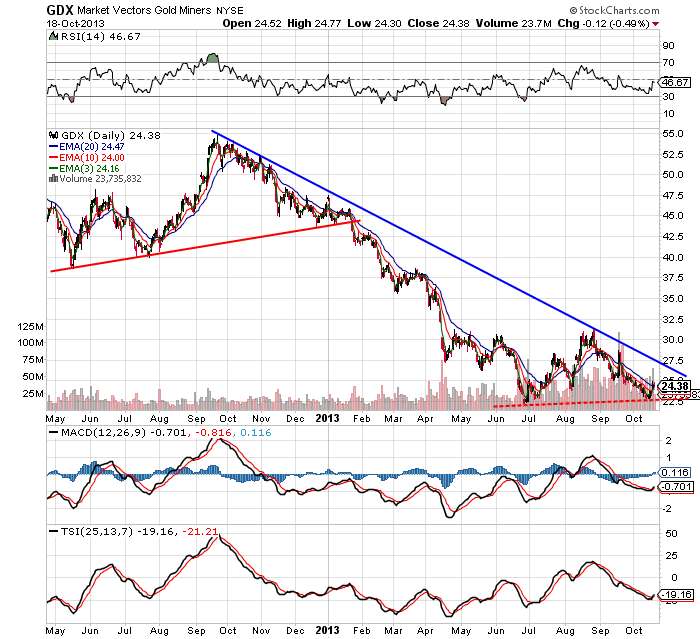
Gold Miners - GDX - I wanted to show a couple of different looks at the miners. The 1 year chart shows a very distinct down trend line. A bull market will not resume until this is broke. With sentiment at absolute rock bottom for this sector, a big technical breakout could signal a huge buying spree. Notice the "W" double bottom back in the summer of 2012.. and then notice we got the same type of action this summer. Will the "W" hold as a double bottom or will it fail again?
1 year
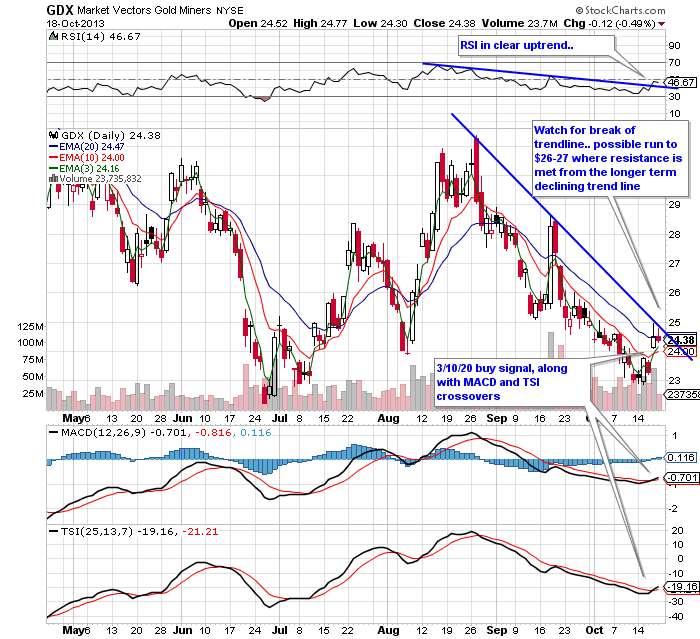
Here's a closer look at the bottom of the "W". The 3/10/20 gave us a buy signal on Friday. One wanting to enter a position in GDX at this point could buy a % of their position based on the ema, and then purchase another portion of their position when breaking the down trendline. A break of this could cause some buying pushing price up against the longer term trend line seen on the 1 year chart.. at about $26-27.
6 Month
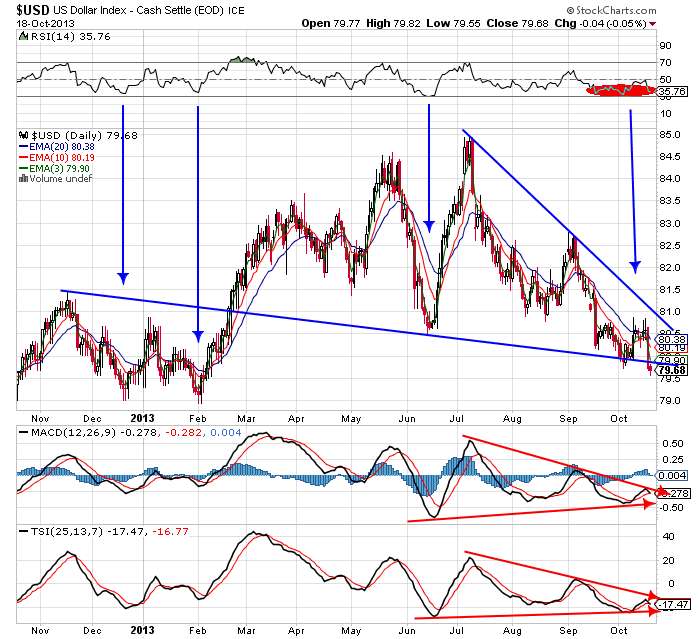
US Dollar Index - $USD - I spent some time this afternoon looking at the current position of the dollar index. I've always had a hard time reading the dollar for some reason. RSI is telling me that we're sitting at a low and should expect some buying. However, MACD and TSI are giving us a bear crossover. I'd also like to point out that price action is trading below an established trendline that began a year ago.. it closed outside of there on Friday. Will it continue to fall from here?
Thanks for reading!
No comments:
Post a Comment